NIFTY 50 (India) Elliott Wave technical analysis [Video]
![NIFTY 50 (India) Elliott Wave technical analysis [Video]](https://editorial.fxstreet.com/images/Markets/Equities/Industries/CommunicationServices/cable-network-man-637435389675652273_XtraLarge.jpg)
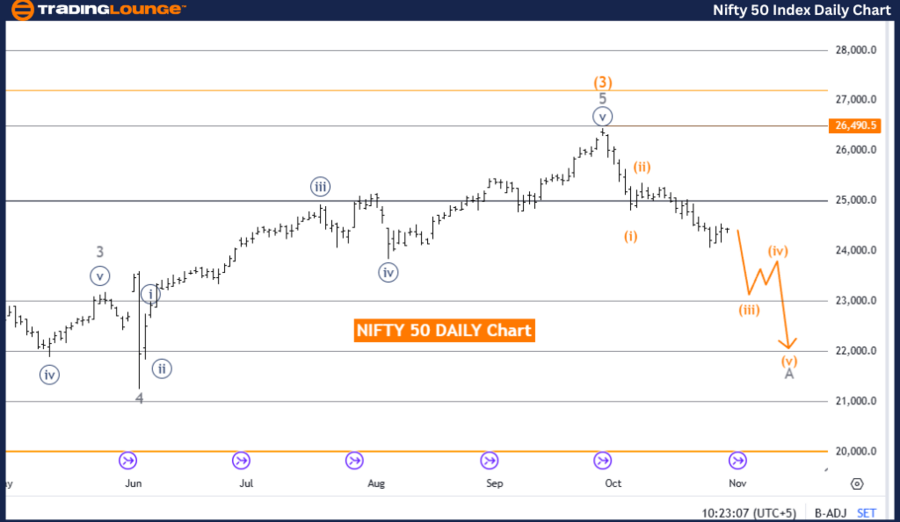
NIFTY 50 (India) Elliott Wave Analysis – Trading Lounge Day Chart
NIFTY 50 (India) Elliott Wave technical analysis
-
Function: Counter Trend.
-
Mode: Impulsive as A.
-
Structure: Gray Wave A.
-
Position: Orange Wave 4.
-
Direction for next higher degrees: Gray Wave B.
-
Details: Orange wave 3 appears complete. Now, A of orange wave 4 is active.
Wave cancellation level: 26490.5.
The daily Elliott Wave analysis for India’s NIFTY 50 index shows a counter-trend in an impulsive structure within a broader corrective phase. Currently, the index is progressing through an impulsive A wave within orange wave 4, marking the beginning of a correction. This counter-trend movement follows the completion of orange wave 3, which had contributed to the previous upward trajectory of the index.
Now, gray wave A within orange wave 4 is active, initiating the correction phase of orange wave 4. This phase represents an expected pause in the upward trend, allowing the market to consolidate recent gains before potentially advancing in subsequent waves. Following gray wave A, gray wave B at the next higher degree is expected to continue this corrective structure, setting the market up for potential future movements. This type of impulsive wave within a corrective phase is common, providing the market with an opportunity to stabilize and build a stronger base for future directional moves.
A key aspect of this analysis is the wave cancellation level, set at 26490.5. This level acts as critical support; if the index drops below it, the current wave count would be invalidated, calling for a revised interpretation of the trend. Staying above this level is crucial for validating the existing corrective structure and supporting the anticipated continuation of orange wave 4.
Summary:
The daily Elliott Wave outlook for NIFTY 50 indicates an impulsive counter-trend within orange wave 4, with gray wave A in progress. The market is in a corrective phase following the completion of orange wave 3, with a support level at 26490.5. As long as this level holds, the structure remains valid, with a potential transition to gray wave B as the market consolidates. This setup provides insight into the expected short-term corrective moves and the continuation of the broader trend.
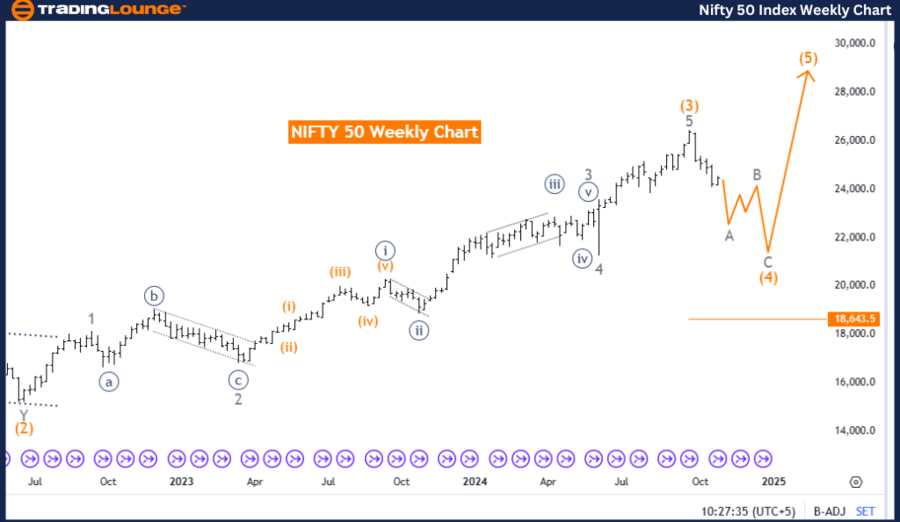
NIFTY 50 (India) Elliott Wave Analysis – Trading Lounge Weekly Chart
NIFTY 50 (India) Elliott Wave technical analysis
-
Function: Counter Trend.
-
Mode: Corrective.
-
Structure: Likely Zigzag.
-
Position: Orange Wave 4.
-
Direction for next higher degrees: Orange Wave 5.
-
Details: Orange wave 3 appears complete. Currently, orange wave 4 is active.
Wave cancellation level: 18643.5.
The weekly Elliott Wave analysis for India’s NIFTY 50 index indicates a counter-trend in a corrective mode, representing a temporary consolidation within a broader upward trend. The current corrective structure, identified as orange wave 4, follows the completion of orange wave 3, which contributed to the previous upward movement. The likely zigzag structure aligns with typical patterns in corrective phases, often featuring a three-part movement aimed at stabilizing prices before the next upward trend resumes.
Now, orange wave 4 is active, signifying a pause in the overall bullish momentum as the market undergoes a retracement or consolidation. Upon the completion of orange wave 4, the outlook suggests the beginning of orange wave 5, which would mark a return to upward movement and the continuation of the larger bullish trend. This corrective phase aligns with Elliott Wave theory, where markets rarely move in straight lines but instead oscillate between advances and consolidations.
A key factor in this analysis is the wave cancellation level set at 18643.5. If the index were to fall below this level, the current wave count would be invalidated, necessitating a reassessment of the wave structure. This level functions as crucial support, preserving the integrity of the current Elliott Wave analysis and indicating the viability of the corrective trend within orange wave 4.
Summary:
The weekly outlook for NIFTY 50 reflects a corrective orange wave 4 within an overarching bullish structure, poised for continuation through wave 5. The 18643.5 level is essential to sustaining this wave pattern, with stability above it supporting the corrective phase before resuming upward momentum. This setup offers insight into NIFTY 50's expected path, anticipating a renewed bullish phase once this correction completes.
Technical analyst: Malik Awais.
NIFTY 50 (India) Elliott Wave technical analysis [Video]
Author

Peter Mathers
TradingLounge
Peter Mathers started actively trading in 1982. He began his career at Hoei and Shoin, a Japanese futures trading company.


