NIFTY 50 Index Wave technical analysis [Video]
![NIFTY 50 Index Wave technical analysis [Video]](https://editorial.fxsstatic.com/images/i/nvidia-01_XtraLarge.jpg)
NIFTY 50 Index Wave technical analysis
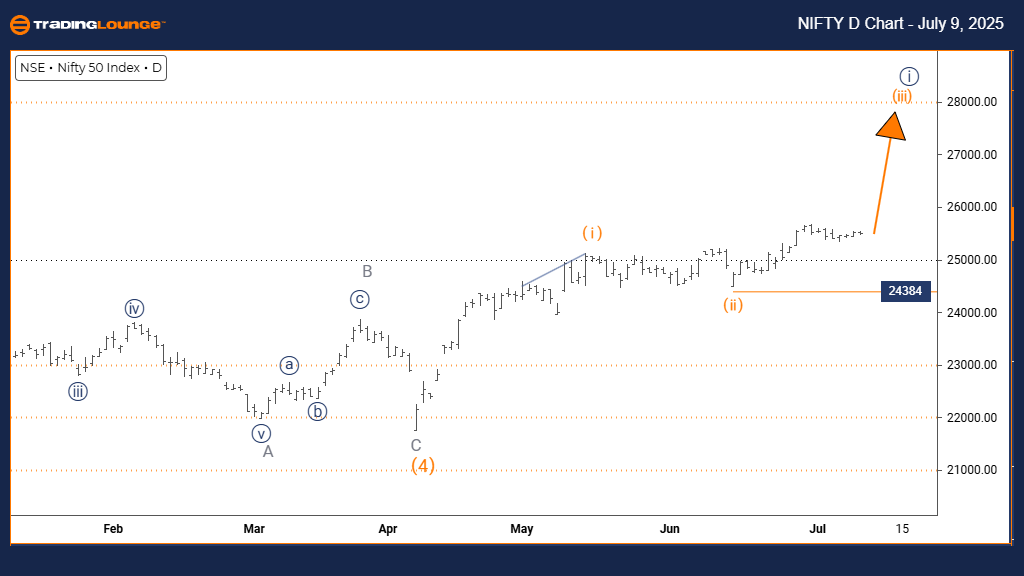
Function: Bullish Trend.
Mode: Impulsive.
Structure: Orange Wave 3.
Position: Navy Blue Wave 1.
Direction next higher degrees: Orange Wave 3 (Started).
Details: Orange Wave 2 appears complete; Orange Wave 3 is now active.
Wave cancel invalid level: 24384.
The NIFTY 50 Index on the daily chart shows a bullish trend based on Elliott Wave theory. Price activity suggests an impulsive pattern with Orange Wave 3 unfolding within Navy Blue Wave 1, indicating the start of a possible extended upward move.
The next wave expected at a higher degree is also Orange Wave 3, which seems to have just begun. The prior corrective phase, Orange Wave 2, appears to have finished. The impulsive nature of the current movement points to rising bullish momentum, supported by increasing buying activity. A break below 24384 would invalidate this wave structure, possibly shifting the outlook to bearish.
Being in Navy Blue Wave 1 implies this move could mark the beginning of a larger bullish cycle, provided price holds above the invalidation level. Traders may continue to view this setup as bullish while waiting for further confirmation. Once Orange Wave 3 completes, a corrective Orange Wave 4 would follow. However, the current priority is monitoring the progress of the ongoing impulsive wave.
Since this analysis uses the daily timeframe, it carries greater significance and reflects institutional sentiment. Wave 3, typically the strongest segment in an Elliott Wave cycle, often brings sharp and dynamic price increases.
Traders should observe price activity around key levels. Wave 3 stages generally offer the most favorable risk-reward conditions. The current structure gives insight into the index’s technical stance and highlights levels that could shift market direction. The bullish view remains valid while the index stays above 24384.
Orange Wave 2’s completion sets a base for further price advances. Traders may consider long setups as long as the wave count remains valid.
NIFTY 50 Index Wave technical analysis
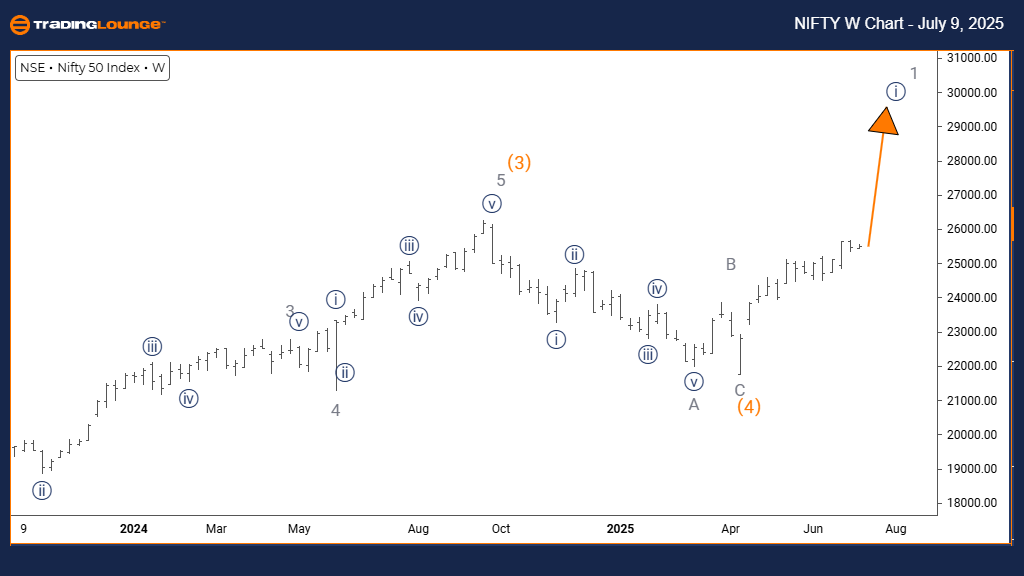
Function: Bullish Trend.
Mode: Impulsive.
Structure: Navy Blue Wave 1.
Position: Gray Wave 1.
Direction next lower degrees: Navy Blue Wave 2.
Details: Orange Wave 4 appears complete; now Navy Blue Wave 1 of Gray Wave 1 is developing.
The NIFTY 50 weekly chart illustrates a bullish trend according to Elliott Wave analysis. The pattern is currently forming Navy Blue Wave 1 within Gray Wave 1, suggesting the early development of a longer-term upward move.
Orange Wave 4 seems to have concluded, with the index now progressing through Navy Blue Wave 1. This phase often marks the initial leg of a major bullish cycle. The price structure aligns with strong market interest, typically seen during impulsive waves. The analysis indicates this setup could lead to a sustained uptrend if wave integrity holds.
The weekly view emphasizes the significance of this trend, capturing broader market direction and institutional strategies. If the current structure proves valid, it would signal the foundation of a new bullish cycle. After completion of this wave, a corrective Navy Blue Wave 2 is anticipated, possibly retracing a portion of the current rise.
Traders should monitor the ongoing impulsive movement for confirmation, remaining cautious about potential pullbacks. This analysis highlights the broader positioning within the Elliott Wave framework, with near-term volatility possible during the expected Wave 2 correction. Still, the general outlook remains optimistic.
Wave 3, typically the most dynamic stage, would follow after Wave 2, potentially offering compelling trade opportunities. The recent conclusion of Orange Wave 4 sets a technical base for the current move. This setup could be especially relevant for medium- to long-term investors seeking to align with broader trends.
The overall structure suggests that NIFTY 50 is transitioning from a corrective to a new impulsive phase. Monitoring Navy Blue Wave 1 and upcoming Wave 2 movements will be key to validating this outlook.
NIFTY 50 Index Wave technical analysis [Video]
Author

Peter Mathers
TradingLounge
Peter Mathers started actively trading in 1982. He began his career at Hoei and Shoin, a Japanese futures trading company.


