Nifty 50 Index Elliott Wave technical analysis [Video]
![Nifty 50 Index Elliott Wave technical analysis [Video]](https://editorial.fxsstatic.com/images/i/General-Stocks_1_XtraLarge.png)
NIFTY Elliott Wave technical analysis
Function: Counter Trend (Minor degree, Grey.).
Mode: Corrective.
Structure: Impulse within larger degree corrective wave.
Position: Minute Wave ((ii)).
Details: Minute Wave ((ii)) could be progressing towards 25000 range before the drop resumes. The correction is unfolding as an expanded flat. Alternatively, the entire structure from 26300 high is unfolding as a correction at Minute degree.
Invalidation point: 26400.
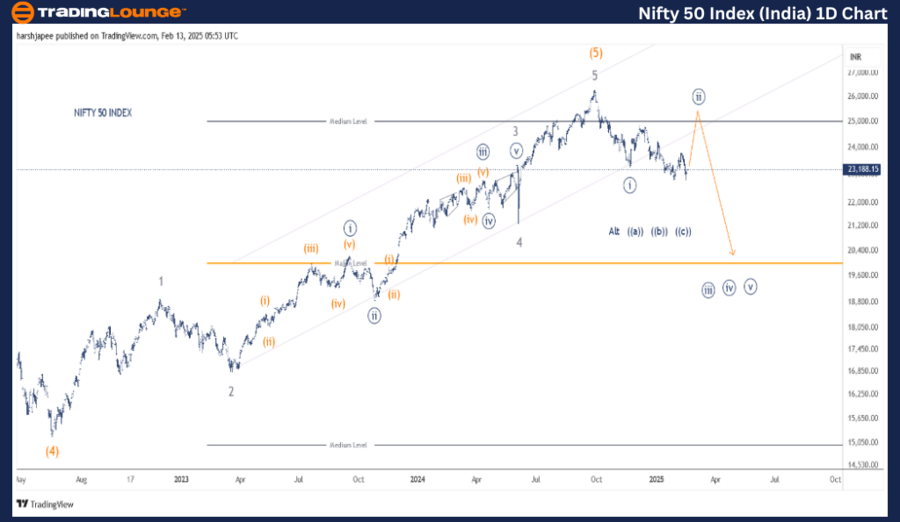
NIFTY 50 Index daily chart technical analysis and potential Elliott Wave counts
NIFTY 50 INDEX daily chart suggests a major top is in place around 26300 mark in September 2024. A high probable wave count could be the index has carved carving Minute Wave ((i)) around the 23267 mark and is unfolding a potential expanded flat corrective wave towards 25000-100 zone.
Earlier, the index had managed to carve Intermediate Wave (4) Orange around the 15200 lows. Since then, an impulse wave at Minor degree labelled 1 through 5, pushed prices through the 26300 mark to terminate Wave (5).
Bears have broadly remained under control since then and a much deeper corrective wave could be unfolding against the 26300 high.
NIFTY Elliott Wave technical analysis
Function: Counter Trend (Minor degree, Grey.).
Mode: Corrective.
Structure: Impulse within larger degree.
Position: Minute Wave ((ii)).
Details: Minute Wave ((ii)) could be progressing towards 25000 range before the drop resumes. The correction is unfolding as an expanded flat marked as Minuette (a)-(b)-(c) on the 4H chart. Alternatively, the entire structure from 26300 high is unfolding as a correction at Minute degree ((a))-((b))-((c)). If the alternate count holds, the index could print below 22700 low before turning higher.
Invalidation point: 26400.
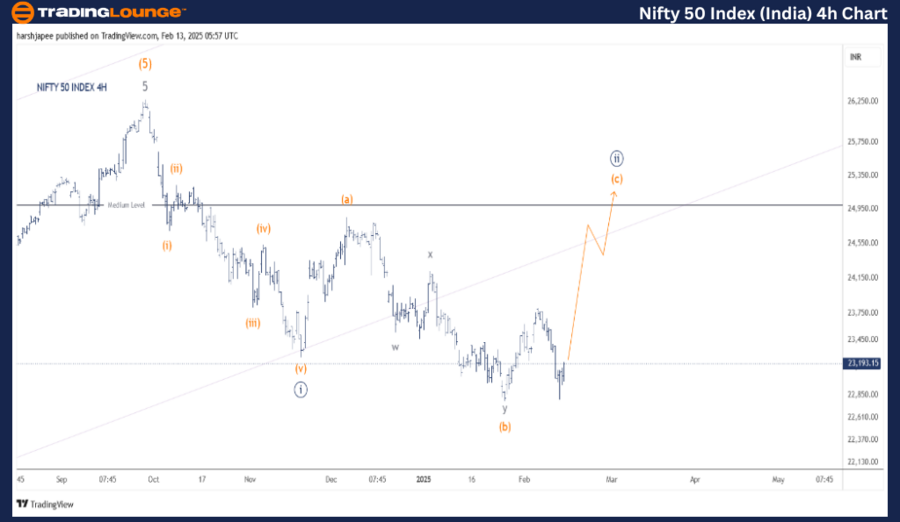
NIFTY 50 Index four-hour chart technical analysis and potential Elliott Wave counts
NIFTY 50 INDEX 4H chart is highlighting the potential counts since the indice print the 26280-300 high on September 27, 2024. The initial drop to 23267 low sub divided into five waves labelled as Minute Wave ((i)). An alternate count has been presented below.
The structure thereafter could be seen unfolding as a potential expanded flat (a)-(b)-(c), which could prepare to push towards 25000-100 region going forward. Waves (a) and (b) seem to be in place around 24800-900 and 22700-800 zones respectively.
If the above holds well, the index could be now unfolding Wave (c) Orange as a potential impulse wave against 22700-800 range. Alternatively, the entire structure from 26300 highs could be a corrective ((a))-((b))-((c)) wave, a part of a larger degree correction.
Conclusion
NIFTY 50 INDEX is progressing higher towards 25000-100 zone within Minuette Wave (c) Orange to terminate Minute Wave ((ii)).
Nifty 50 Index Elliott Wave technical analysis [Video]
Author

Peter Mathers
TradingLounge
Peter Mathers started actively trading in 1982. He began his career at Hoei and Shoin, a Japanese futures trading company.


