|

NFLX: Found buyers from blue box area

in this article we will analyze our forecast for NFLX in the short term cycle. Since the short term peak of NFLX from 05.12.2023 to end wave 3 we have been expecting a pullback within wave 4 to take place. Here at Elliott Wave Forecast we have in place a system that allows us to measure an area in which we can expect a react to take place.

We call it equal legs area or blue box area as you might have seen within our charts. These areas provide us with at least an 85% chance of a minimum of 3 waves bounce or reaction to take place. We can use these areas to enter in the market with a defined entry, Stop Loss and exit strategy.

We teach how to use our system within our member’s area and live trading room. Once a member or in trial you will be able to gather more of that information under your disposal. Nevertheless, let’s have a look now on the 45 mins chart of NFLX as provided to members from 05.17.2023. We have been expecting little more downside to reach the blue box area before turning higher.

NFLX 45 min chart pre market update 05.17.2023

Chart

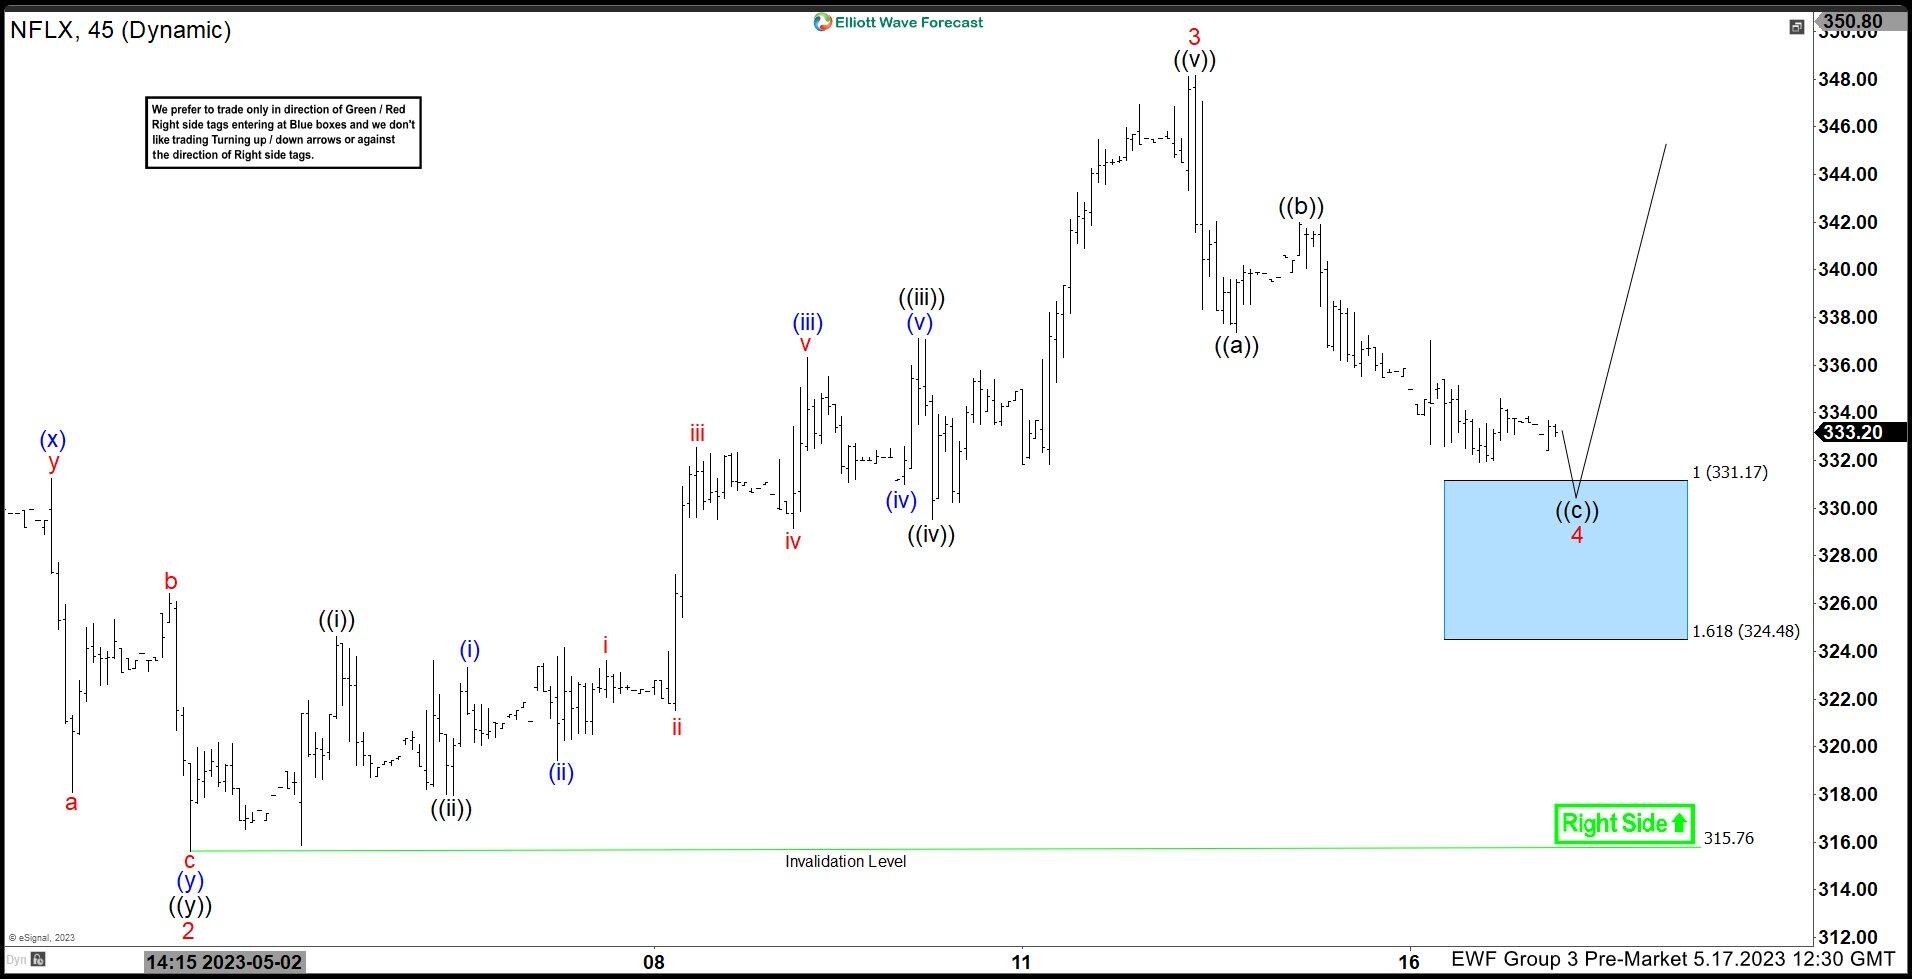
As we can see the market was marginally above within blue box area of 331.17 – 324.48 and we have been expecting a dip to reach the area. We recommend members to always buy from the 100% extension area with a stop loss just below the 1.618 area. Fast forward, towards the post market update now from 05.19.2023, we will see that the market has already reacted higher and what we expect next.

NFLX 45 min chart post market update 05.19.2023

Chart

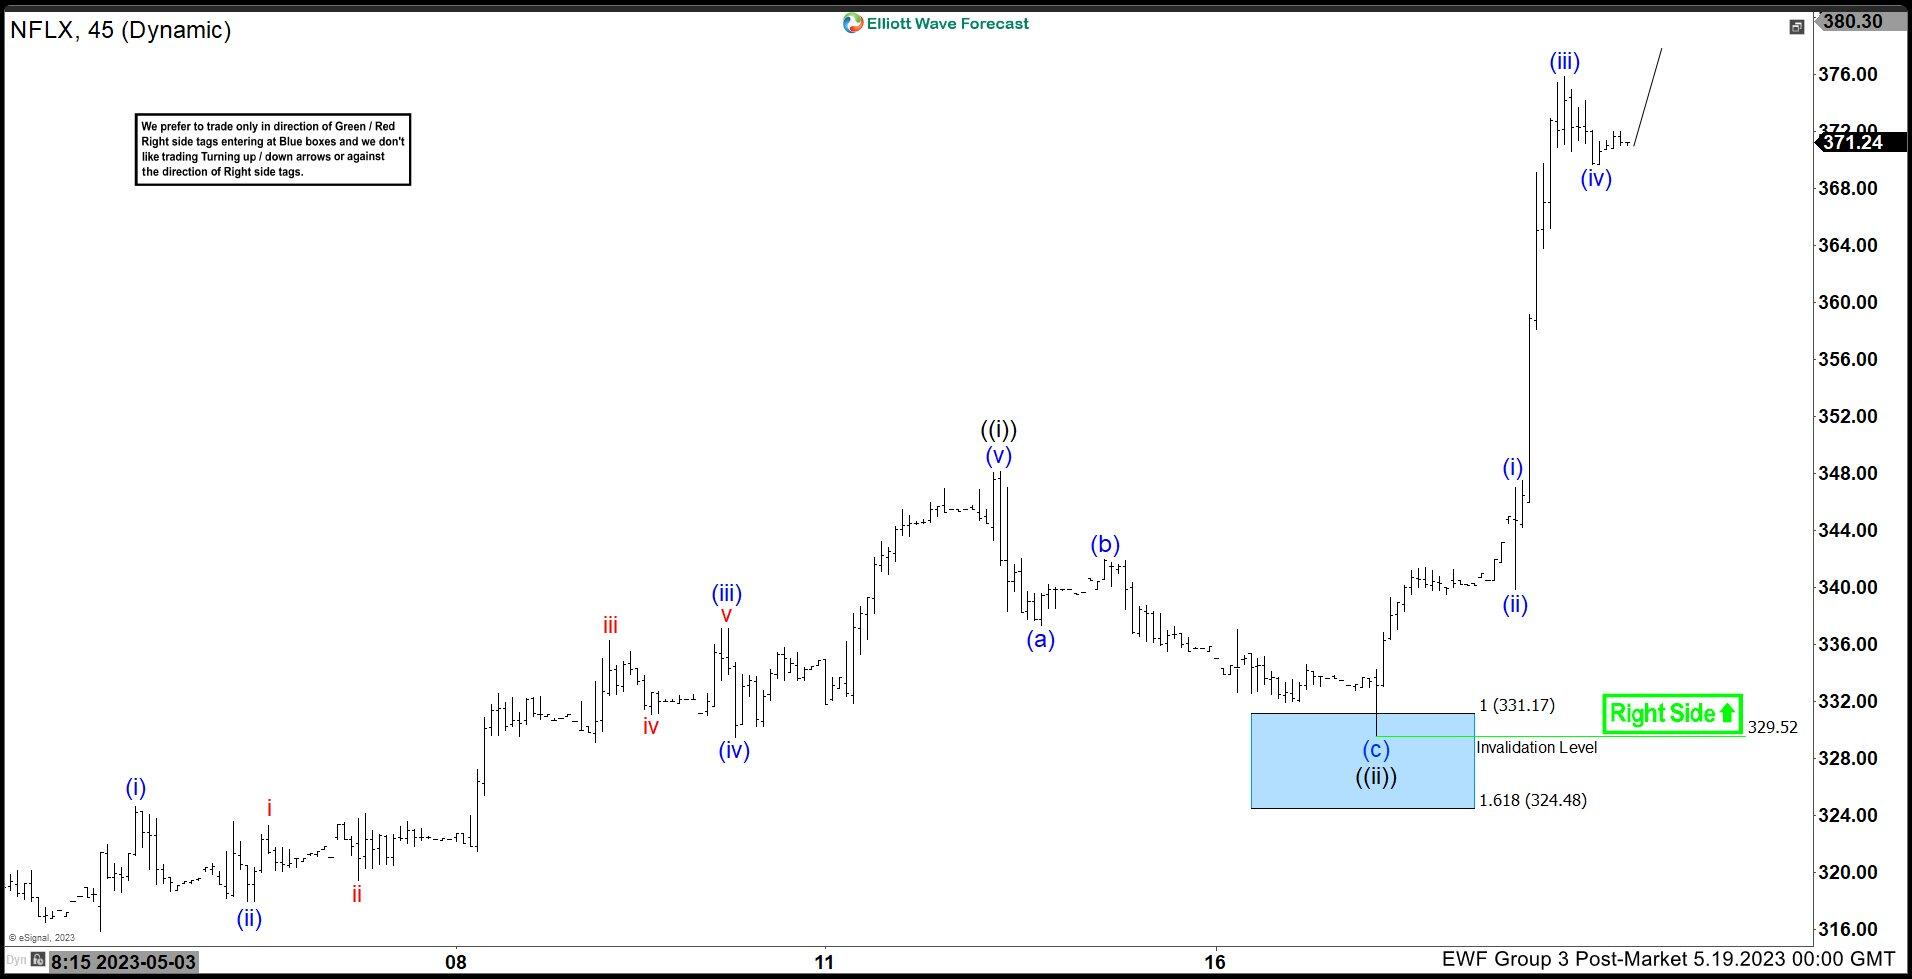
A very clear reaction higher took place from 329.52 inside the blue box area. The reaction higher as an impulse within wave  (iii) of ((iii)). After wave (iv) expecting one more high in (v) to end ((iii)) before a pullback in ((iv)). We have switched the view to the more aggressive one. You can learn more once become a member at Elliott Wave Forecast. Join us to learn the next trading opportunities in Netflix and other Stocks or ETFs. Belongs to our Group 3 of instruments.

Author

Elliott Wave Forecast Team

Elliott Wave Forecast Team

ElliottWave-Forecast.com

More from Elliott Wave Forecast Team
Share:

Editor's Picks

EUR/USD looks sidelined around 1.1850

EUR/USD remains on the back foot, extending its bearish tone and sliding towards the 1.1850 area to print fresh daily lows on Monday. The move lower comes as the US Dollar gathers modest traction, with thin liquidity and subdued volatility amplifying price swings amid the US market holiday.

GBP/USD flirts with daily lows near 1.3630

GBP/USD has quickly given back Friday’s solid gains, turning lower at the start of the week and drifting back towards the 1.3630 area. The focus now shifts squarely to Tuesday’s UK labour market report, which is likely to keep the quid firmly in the spotlight and could set the tone for Cable’s next move.

Gold battle around $5,000 continues

Gold is giving back part of Friday’s sharp rebound, deflating below the key $5,000 mark per troy ounce as the new week gets underway. Modest gains in the US Dollar are keeping the metal in check, while thin trading conditions, due to the Presidents Day holiday in the US, are adding to the choppy and hesitant tone across markets.

Bitcoin consolidates as on-chain data show mixed signals

Bitcoin price has consolidated between $65,700 and $72,000 over the past nine days, with no clear directional bias. US-listed spot ETFs recorded a $359.91 million weekly outflow, marking the fourth consecutive week of withdrawals.

The week ahead: Key inflation readings and why the AI trade could be overdone

It is likely to be a quiet start to the week, with US markets closed on Monday for Presidents Day. European markets are higher across the board and gold is clinging to the $5,000 level after the tamer than expected CPI report in the US reduced haven flows to precious metals.

XRP steadies in narrow range as fund inflows, futures interest rise

Ripple is trading in a narrow range between $1.45 (immediate support) and $1.50 (resistance) at the time of writing on Monday. The remittance token extended its recovery last week, peaking at $1.67 on Sunday from the weekly open at $1.43.