NextEra Energy Inc (NEE) stocks Elliott Wave technical analysis [Video]
![NextEra Energy Inc (NEE) stocks Elliott Wave technical analysis [Video]](https://editorial.fxstreet.com/images/Markets/Equities/DowJones/financial-planning-with-stock-chart-and-pen-17530871.jpg)
NEE Elliott Wave Analysis Trading Lounge.
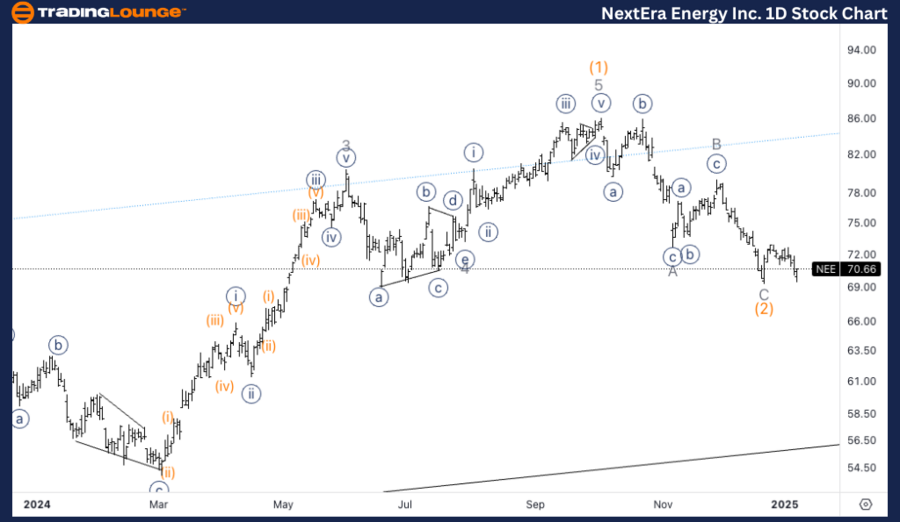
NextEra Energy Inc., (NEE) Daily Chart.
NEE Elliott Wave technical analysis
Function: Counter Trend.
Mode: Corrective.
Structure: Flat.
Position: Wave C of (2).
Direction: Bottom in wave C.
Details: Looking for a potential bottom in wave (2) as we have reached the area of the previous 4 which is often times a target for wave C of the same degree.
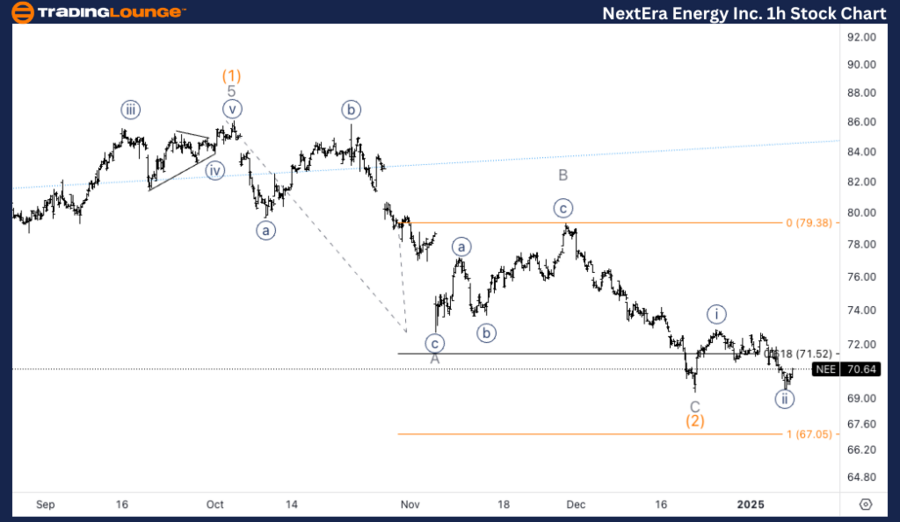
NextEra Energy Inc., (NEE) 1H Chart.
NEE Elliott Wave technical analysis
Function: Counter Trend.
Mode: Corrective.
Structure: Flat.
Position: Wave C of (2).
Direction: Bottom in wave C.
Details: Here we are looking at a potential wave {i} and {ii} in place knowing we are very close to invalidation level, which is why we are looking at upside confirmation.
This Elliott Wave analysis of NextEra Energy Inc., (NEE) outlines both the daily and 1-hour chart structures, highlighting the current trends and possible future price movements.
NEE Elliott Wave technical analysis – Daily chart
NextEra Energy seems to be approaching a wave C of (2) bottom. The price has moved into the region of the prior wave 4, which is often a common target for the end of wave C corrections. A reversal or confirmation of the bottom in wave C would signal the end of the (2) correction, allowing for the next potential impulsive wave upward to begin.
NEE Elliott Wave technical analysis – One-hour chart
On the 1-hour chart, we are examining the completion of wave C and the early formation of wave {i} and {ii}. However, we are close to an invalidation level, meaning caution is warranted until we see clear upside confirmation. Any break above key resistance levels could validate the end of wave C and initiate the start of a bullish reversal.
Technical analyst: Alessio Barretta.
NEE Elliott Wave technical analysis [Video]
Author

Peter Mathers
TradingLounge
Peter Mathers started actively trading in 1982. He began his career at Hoei and Shoin, a Japanese futures trading company.


