|

NexGen Enery (NXE) may have ended correction

NexGen Energy Ltd. (NXE) is a uranium exploration and development company based in Vancouver, British Columbia. They focus on high-impact projects in the Athabasca Basin in Saskatchewan, Canada. This area is known for having the highest-grade uranium deposits in the world. Below is the latest long term update of the stock.

$NXE weekly Elliott Wave chart as of September 17. 2024

Chart

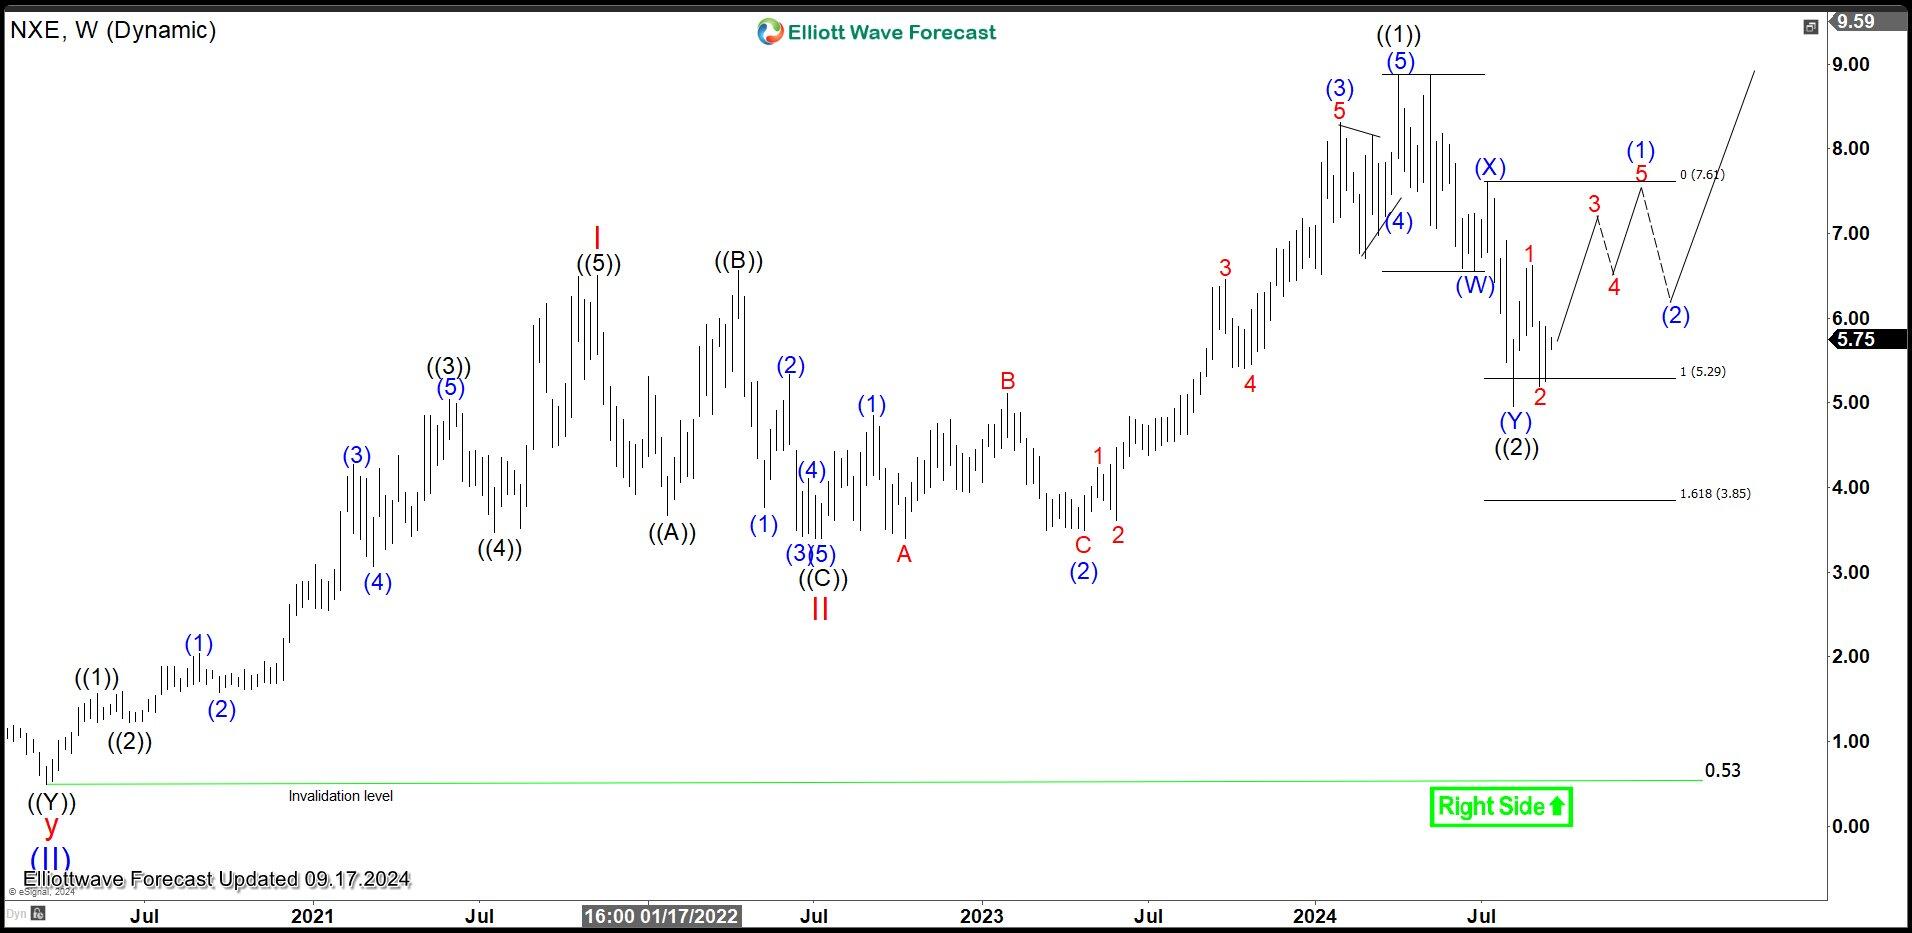
Weekly chart of NXE above shows that the stock ended Super Cycle degree wave (II) at 0.53. From there, the stock then rallies in wave (III) with internal subdivision as a 5 waves impulse. Up from wave (II), wave I ended at 6.5 and pullback in wave II ended at 3.4. The stock has rallied higher in wave III. Up from wave II, wave ((1)) ended at 8.88 and dips in wave ((2)) is proposed complete at 4.95. Expect the stock to extend higher in wave ((3)) while it stays above 4.95, and more importantly above 0.53 low.

$NXE daily Elliott Wave chart as of September 17, 2024

Chart

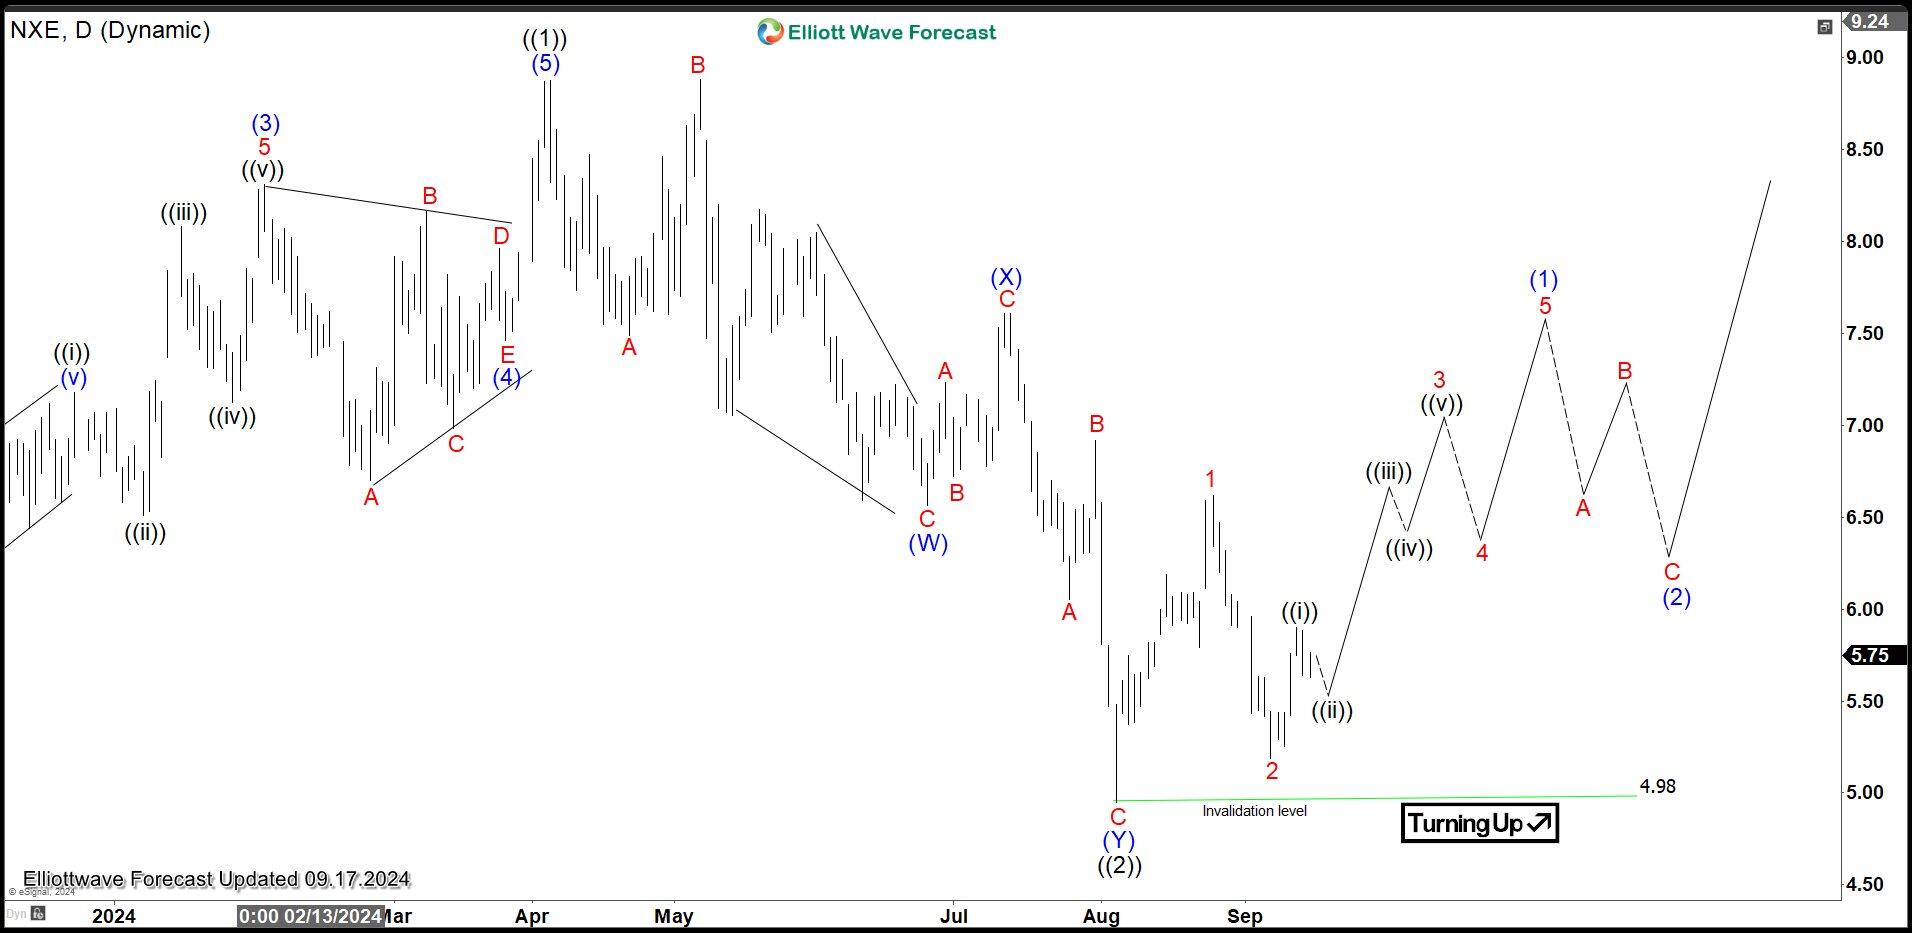
Daily Elliott Wave Chart of NextGen Energy (NXE) above shows that the stock ended wave ((1)) 8.88. Afterwards, the stock corrected cycle from July 2022 in wave ((2)) with internal subdivision as a double three structure. Down from wave ((1)), wave (W) ended at 6.57 and wave (X) ended at 7.61. Wave (Y) lower ended at 4.98 which completed wave ((2)). The stock then turns higher in wave ((3)). Up from wave ((2)), wave 1 ended at 6.62 and wave 2 pullback ended at 5.19. Near term, as far as pivot at 4.98 low stays intact, expect the stock to extend higher.

Author

Elliott Wave Forecast Team

Elliott Wave Forecast Team

ElliottWave-Forecast.com

More from Elliott Wave Forecast Team
Share:

Markets move fast. We move first.

Orange Juice Newsletter brings you expert driven insights - not headlines. Every day on your inbox.

By subscribing you agree to our Terms and conditions.

Editor's Picks

EUR/USD flatlines below 1.1800 amid trading lull, awaits Fed Minutes

EUR/USD trades around a flatline below 1.1800 in European trading on Tuesday. The pair lacks any trading impetus as the US Dollar moves little amid market caution ahead of the Fed's December Meeting Minutes release, which could offer insights into the Federal Reserve’s 2026 outlook.

GBP/USD retakes 1.3500 despite the year-end grind

GBP/USD finds fresh demand and retakes 1.3500 on Tuesday as markets grind through the last trading week of the year. Despite the latest uptick, the pair is unlikely to see further progress due to the year-end holiday volumes.

Gold holds the bounce on Fed rate cut bets, safe-haven flows

Gold holds the rebound near $4,350 in the European trading hours on Tuesday. The precious metal recovers some lost ground after falling 4.5% in the previous session, which was Gold's largest single-day loss since October. Increased margin requirements on gold and silver futures by the Chicago Mercantile Exchange Group, one of the world’s largest trading floors for commodities, prompted widespread profit-taking and portfolio rebalancing.

Tron steadies as Justin Sun invests $18 million in Tron Inc.

Tron (TRX) trades above $0.2800 at press time on Monday, hovering below the 50-day Exponential Moving Average (EMA) at $0.2859.

Economic outlook 2026-2027 in advanced countries: Solidity test

After a year marked by global economic resilience and ending on a note of optimism, 2026 looks promising and could be a year of solid economic performance. In our baseline scenario, we expect most of the supportive factors at work in 2025 to continue to play a role in 2026.

Crypto market outlook for 2026

Year 2025 was volatile, as crypto often is.  Among positive catalysts were favourable regulatory changes in the U.S., rise of Digital Asset Treasuries (DAT), adoption of AI and tokenization of Real-World-Assets (RWA).