|

Netflix (NFLX) looking for double correction [Video]

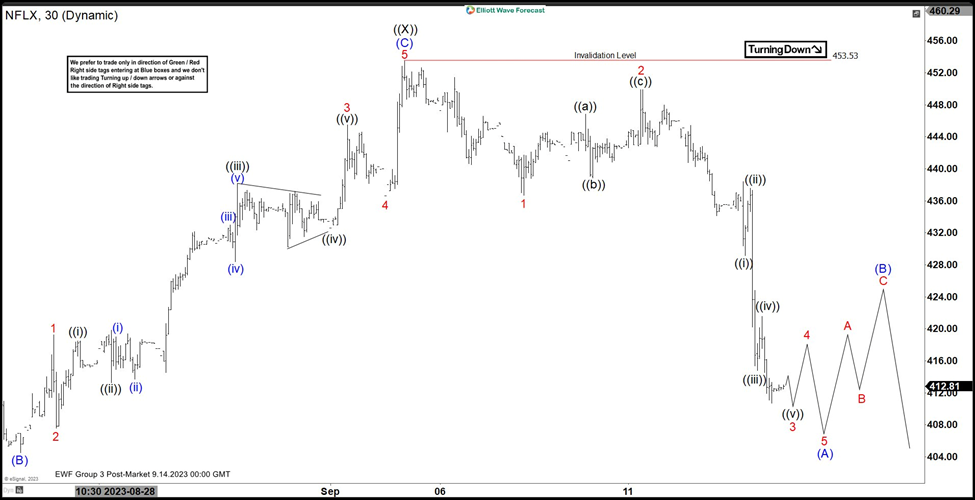
Netflix (NFLX) decline from 7.20.2023 high is unfolding as a double three Elliott Wave structure. Down from 7.20.2023 high, wave (A) ended at 411.88 and rally in wave (B) ended at 445.25. Wave (C) lower ended at 398.15 which completed wave ((W)). Rally in wave ((X)) ended at 453.53 with internal subdivision as a zigzag strcuture. Up from wave ((W)), wave (A) ended at 437.02 and pullback in wave (B) ended at 404.50. Wave (C) lower took the form of a 5 waves impulse which ended at 453.53 as the 30 minutes chart below shows. This completed wave ((X)) in higher degree. The stock then turned lower in wave ((Y)).

Down from wave ((X)), wave 1 ended at 436.7 and rally in wave 2 ended at 449.89. Internal subdivision of wave 2 unfolded as a zigzag. Up from wave 1, wave ((a)) ended at 446.81, pullback in wave ((b)) ended at 438.85 and wave ((c)) higher ended at 449.88 which completed wave 2. Down from wave 2, wave ((i)) ended at 429.17 and wave ((ii)) ended at 437.59. Wave ((iii)) ended at 414.81 and wave ((iv)) ended at 421.55. Expect the stock to extend lower in wave ((v)) which should complete wave 3. Afterwards, it should rally in wave 4 before another leg lower to end wave 5 of (A). Near term, as far as pivot at 453.53 high stays intact, expect rally to fail in 3, 7, or 11 swing for further downside.

Netflix (NFLX) 30 minutes Elliott Wave chart

NFLX Elliott Wave video

Author

Elliott Wave Forecast Team

Elliott Wave Forecast Team

ElliottWave-Forecast.com

More from Elliott Wave Forecast Team
Share:

Markets move fast. We move first.

Orange Juice Newsletter brings you expert driven insights - not headlines. Every day on your inbox.

By subscribing you agree to our Terms and conditions.

Editor's Picks

EUR/USD bounces toward 1.1750 as US Dollar loses strength

EUR/USD returned to the 1.1750 price zone in the American session on Friday, despite falling Wall Street, which indicates risk aversion. Trading conditions remain thin following the New Year holiday and ahead of the weekend, with the focus shifting to US employment and European data scheduled for next week.

GBP/USD nears 1.3500, holds within familiar levels

After testing 1.3400 on the last day of 2025, GBP/USD managed to stage a rebound. Nevertheless, the pair finds it difficult to gather momentum and trades with modest intraday gains at around 1.3490 as market participants remain in holiday mood.

Gold trims intraday gains, approaches $4,300

Gold retreated sharply from the $4,400  area and trades flat for the day in the $4,320 price zone. Choppy trading conditions exacerbated the intraday decline, although XAU/USD bearish case is out of the picture, considering growing expectations for a dovish Fed and persistent geopolitical tensions.

Cardano gains early New Year momentum, bulls target falling wedge breakout

Cardano kicks off the New Year on a positive note and is extending gains, trading above $0.36 at the time of writing on Friday. Improving on-chain and derivatives data point to growing bullish interest, while the technical outlook keeps an upside breakout in focus.

Economic outlook 2026-2027 in advanced countries: Solidity test

After a year marked by global economic resilience and ending on a note of optimism, 2026 looks promising and could be a year of solid economic performance. In our baseline scenario, we expect most of the supportive factors at work in 2025 to continue to play a role in 2026.

Crypto market outlook for 2026

Year 2025 was volatile, as crypto often is.  Among positive catalysts were favourable regulatory changes in the U.S., rise of Digital Asset Treasuries (DAT), adoption of AI and tokenization of Real-World-Assets (RWA).