|

Netflix is in process of doing five waves advance

Short Term Elliott Wave view in Netflix ticker symbol: $NFLX suggests that rally from 8.05.2024 low is incomplete & should continue upside. It is showing 3 swing higher since August-2024 low & expect more upside against 11.18.2024 low. It ended 1 at $736 high as diagonal & 2 correction at $669 low. Within 1, it placed ((i)) at $711.33 high, ((ii)) at $660.80 low & ((iii)) at $728 high. Wave ((iv)) ended at $696.43 low & finally ((v)) ended at $736 high as wave 1. Within 2 correction, it placed ((a)) at $699.78 low, ((b)) at $710.24 high & ((c)) at $669 low near 50% Fibonacci retracement of 1.

Netflix (NFLX) latest 45-minutes Elliott Wave chart

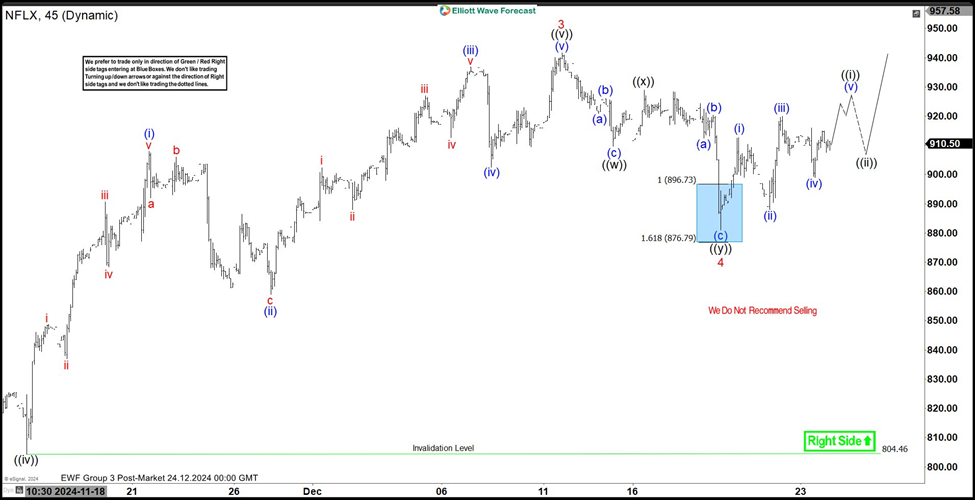
Above 2 low, it favors upside in wave 3 in another 5 waves impulse sequence. Whereas wave ((i)) ended at $773 high, wave ((ii)) ended at $744.26 low. Wave ((iii)) ended at $841 high, wave ((iv)) ended at $804.30 low and wave ((v)) at $941.75 high. Below from there, the stock made a pullback in wave 4 to correct the cycle from 10.17.2024 low. The internals of that pullback unfolded as Elliott wave double three structure where wave ((w)) ended at $909.61 low in a lesser degree 3 waves.

A bounce to $928.94 high ended wave ((x)) and started the ((y)) leg lower towards $896.73- $876.79 blue box area where buyers were expected to appear. Since then the stock has reacted higher from the blue box area allowed longs to get into a risk free position. Therefore ended wave 4 pullback at $881.01 within the blue box area. Near-term, as far as dips remain above $881.01 low and more importantly above $804.46 low the stock is expected to resume the upside in wave 5. For minimum extension target towards $956.38- $979.68 area higher (inverse 123.6%- 161.8% Fib extension of wave 4). Before ending the cycle from 8.05.2024 low in 5 waves advance & making a pullback.

Netflix Elliott Wave [Video]

Author

Elliott Wave Forecast Team

Elliott Wave Forecast Team

ElliottWave-Forecast.com

More from Elliott Wave Forecast Team
Share:

Editor's Picks

EUR/USD flirts with daily highs, retargets 1.1900

EUR/USD regains upside traction, returning to the 1.1880 zone and refocusing its attention to the key 1.1900 barrier. The pair’s slight gains comes against the backdrop of a humble decline in the US Dollar as investors continue to assess the latest US CPI readings and the potential Fed’s rate path.

GBP/USD remains well bid around 1.3650

GBP/USD maintains its upside momentum in place, hovering around daily highs near 1.3650 and setting aside part of the recent three-day drop. Cable’s improved sentiment comes on the back of the Greenback’s  irresolute price action, while recent hawkish comments from the BoE’s Pill also collaborate with the uptick.

Gold clings to gains just above $5,000/oz

Gold is reclaiming part of the ground lost on Wednesday’s marked decline, as bargain-hunters keep piling up and lifting prices past the key $5,000 per troy ounce. The precious metal’s move higher is also underpinned by the slight pullback in the US Dollar and declining US Treasury yields across the curve.

Crypto Today: Bitcoin, Ethereum, XRP in choppy price action, weighed down by falling institutional interest 

Bitcoin's upside remains largely constrained amid weak technicals and declining institutional interest. Ethereum trades sideways above $1,900 support with the upside capped below $2,000 amid ETF outflows.

Week ahead – Data blitz, Fed Minutes and RBNZ decision in the spotlight

US GDP and PCE inflation are main highlights, plus the Fed minutes. UK and Japan have busy calendars too with focus on CPI. Flash PMIs for February will also be doing the rounds. RBNZ meets, is unlikely to follow RBA’s hawkish path.

Ripple Price Forecast: XRP potential bottom could be in sight

Ripple edges up above the intraday low of $1.35 at the time of writing on Friday amid mixed price actions across the crypto market. The remittance token failed to hold support at $1.40 the previous day, reflecting risk-off sentiment amid a decline in retail and institutional sentiment.