Netflix Inc. (NFLX) Elliott Wave technical analysis [Video]
![Netflix Inc. (NFLX) Elliott Wave technical analysis [Video]](https://editorial.fxstreet.com/images/Markets/Equities/Industries/Media/Netflix.jpg)
NFLX Elliott Wave Analysis Trading Lounge.
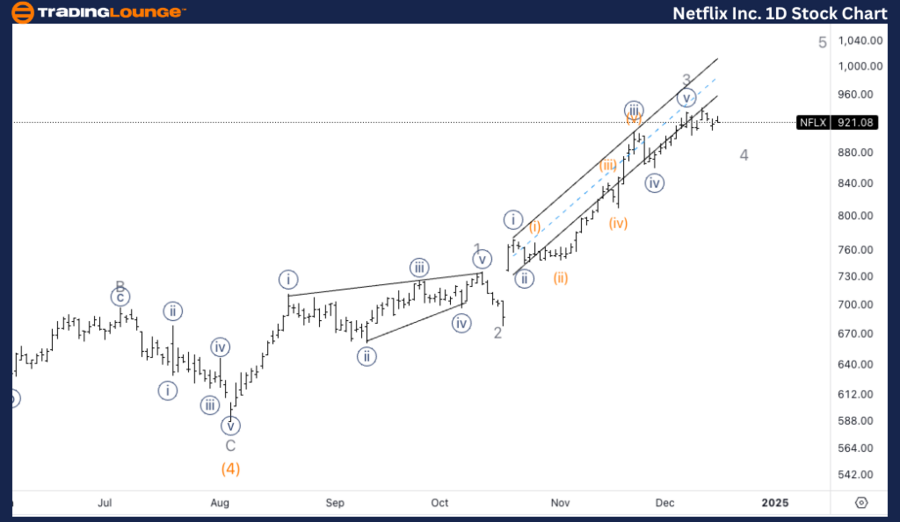
Netflix Inc., (NFLX) daily chart.
NFLX Elliott Wave technical analysis
Function: Trend.
Mode: Impulsive.
Structure: Motive.
Position: Wave 3 of (5).
Direction: Upside within wave (5).
Details: Looking for upside into wave (5) towards Trading Level 1 at 1000$. We seem to be missing another larger pullback in wave 4 before resuming higher into ave 5 of (5).
NFLX Elliott Wave technical analysis – Daily chart
The daily chart suggests that wave 3 of (5) is progressing, with the stock aiming for further upside towards TradingLevel1 at $1000. However, before this target is reached, a larger pullback is expected in wave 4, which would then set the stage for a final advance into wave 5 of (5). This corrective phase will offer a more sustainable foundation for the next leg higher.
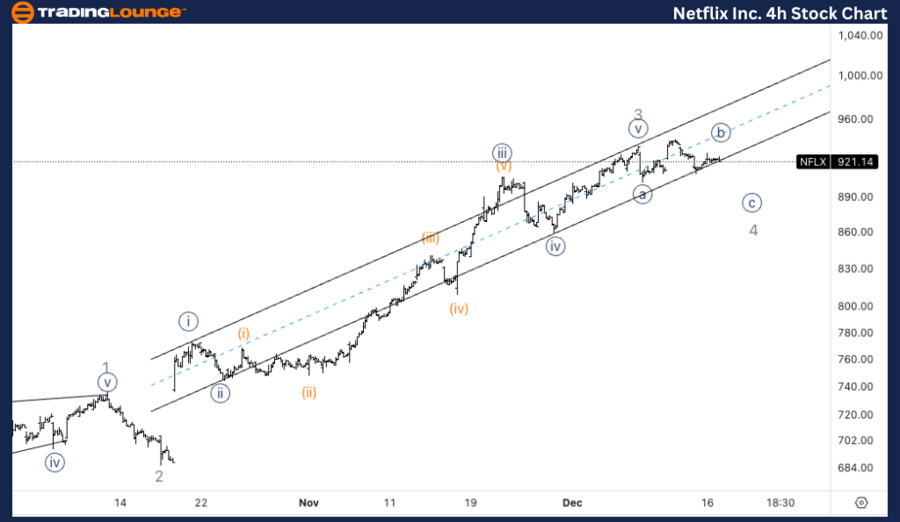
Netflix Inc., (NFLX) one-hour chart.
NFLX Elliott Wave technical analysis
Function: Trend.
Mode: Impulsive.
Structure: Motive.
Position: Wave {b} of 4.
Direction: Bottom in wave {c}.
Details: Looking for another leg lower into wave {c} of 4 as we could have a top in wave {v} as we have a perfect match with the parallel base channel of {ii} and {iv}.
NFLX Elliott Wave technical analysis – One-hour chart
On the 1-hour chart, wave {b} of 4 is developing, and the analysis suggests another leg down into wave {c} of 4. There appears to be a potential top in wave {v}, and the current move down could lead to a bottom within the parallel base channel created by waves {ii} and {iv}. This decline would complete the corrective structure, paving the way for the next upside movement.
In this Elliott Wave analysis, we will review the trend structure of Netflix Inc., (NFLX) using both the daily and 1-hour charts to assess the current wave position and potential price movements.
Netflix Inc. (NFLX) Elliott Wave technical analysis [Video]
Author

Peter Mathers
TradingLounge
Peter Mathers started actively trading in 1982. He began his career at Hoei and Shoin, a Japanese futures trading company.


