Chargepoint Holdings Inc. is an US American electric vehicle infrastructure company. Founded 2007 as Coulomb Technologies, headquartered in Campbell, California, US and traded under the ticker $CHPT at NYSE, it is a component of the Russel1000 index. First of all, Chargepoint operates the largest online network of independently owned EV charging stations operating in 14 countries. Moreover, it makes the technology used in it. While 2017 it owned 36’000 stations, in January 2023 this number went to 225’000. Without any doubt, that augmentation demonstrates an obvious demand for EV infrastructure.
Currently, we can see energy market looking for next turn higher. Also from the fundamental perspective, energy in general and electricity in particular should remain determinant for society and economy. Therefore, an investment in shares of an EV infrastructure company can provide an exposure to the rising prices in this segment. Hereby, Chargepoint Holdings Inc. as a market leader should remain an excellent investment candidate.
Chargepoint weekly Elliott Wave analysis 05.30.2023
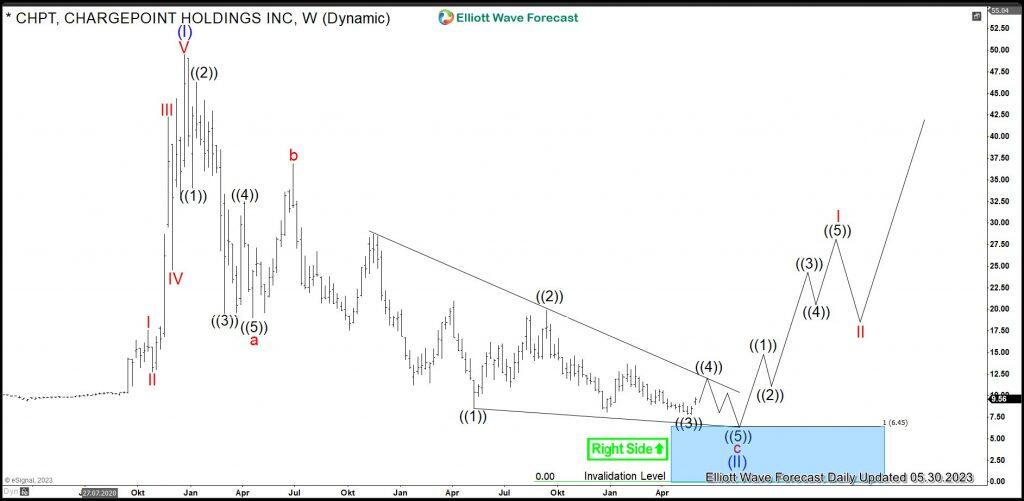
The weekly chart below shows the Chargepoint shares $CHPT traded at New York Stock Exchange. From the all-time lows, the stock price has developed a cycle higher in wave (I). It has printed the all-time highs in December 2020 at 49.48. Within the impulsive advance in wave (I), red wave III shows an extension. From the 2020 highs, a correction lower in wave (II) is unfolding as an Elliott wave zigzag pattern being a 5-3-5 structure.
Firstly, 5 waves of red wave a have ended in April 2021 at 19.04 lows. Secondly, a bounce in 3 swings as red wave b has set a connector in June 2021 at 36.86 highs. Finally, 3rd swing lower in red wave c is unfolding as an ending diagonal. As a matter of fact, break of 19.04 lows has opened a bearish sequence. As long as price holds below 36.86, it can reach deeper towards weekly support area. Investors and traders can be looking to buy $CHPT from 6.45-0.00 area. There, blue wave (II) should find its bottom and next bullish cycle in blue wave (III) should start. The target for blue wave (III) will be 49.48 and higher.
FURTHER DISCLOSURES AND DISCLAIMER CONCERNING RISK, RESPONSIBILITY AND LIABILITY Trading in the Foreign Exchange market is a challenging opportunity where above average returns are available for educated and experienced investors who are willing to take above average risk. However, before deciding to participate in Foreign Exchange (FX) trading, you should carefully consider your investment objectives, level of xperience and risk appetite. Do not invest or trade capital you cannot afford to lose. EME PROCESSING AND CONSULTING, LLC, THEIR REPRESENTATIVES, AND ANYONE WORKING FOR OR WITHIN WWW.ELLIOTTWAVE- FORECAST.COM is not responsible for any loss from any form of distributed advice, signal, analysis, or content. Again, we fully DISCLOSE to the Subscriber base that the Service as a whole, the individual Parties, Representatives, or owners shall not be liable to any and all Subscribers for any losses or damages as a result of any action taken by the Subscriber from any trade idea or signal posted on the website(s) distributed through any form of social-media, email, the website, and/or any other electronic, written, verbal, or future form of communication . All analysis, trading signals, trading recommendations, all charts, communicated interpretations of the wave counts, and all content from any media form produced by www.Elliottwave-forecast.com and/or the Representatives are solely the opinions and best efforts of the respective author(s). In general Forex instruments are highly leveraged, and traders can lose some or all of their initial margin funds. All content provided by www.Elliottwave-forecast.com is expressed in good faith and is intended to help Subscribers succeed in the marketplace, but it is never guaranteed. There is no “holy grail” to trading or forecasting the market and we are wrong sometimes like everyone else. Please understand and accept the risk involved when making any trading and/or investment decision. UNDERSTAND that all the content we provide is protected through copyright of EME PROCESSING AND CONSULTING, LLC. It is illegal to disseminate in any form of communication any part or all of our proprietary information without specific authorization. UNDERSTAND that you also agree to not allow persons that are not PAID SUBSCRIBERS to view any of the content not released publicly. IF YOU ARE FOUND TO BE IN VIOLATION OF THESE RESTRICTIONS you or your firm (as the Subscriber) will be charged fully with no discount for one year subscription to our Premium Plus Plan at $1,799.88 for EACH person or firm who received any of our content illegally through the respected intermediary’s (Subscriber in violation of terms) channel(s) of communication.
Recommended content
Editors’ Picks
EUR/USD loses traction, retreats below 1.0600

EUR/USD lost its recovery momentum and declined below 1.0600 in the American session on Friday, erasing a portion of its daily gains in the process. Nevertheless, the risk-positive market atmosphere after PCE inflation data helps the pair limit its losses.
GBP/USD turns negative on the day below 1.2200

GBP/USD reversed its direction and slumped below 1.2200 in the American session on Friday after rising above 1.2270 earlier in the day. Position readjustments and profit-taking on the last trading day of the quarter seems to be weighing on Pound Sterling.
Gold reverses direction, drops below $1,860

Following a steady rebound toward $1,880 on Friday, Gold price made a sharp U-turn and turned negative on the day near $1,860. Although the 10-year US T-bond yield is down more than 1%, XAU/USD struggles to find demand on the last day of Q3.
Polkadot Price Forecast: DOT reversal seems inevitable after 92% correction from all-time high

Polkadot price, in nearly two years, has shed 92.91% from its all-time high of $55.09. The massive downswing in DOT has pushed it down to levels that were last seen in October 2020. Hence, the chances of this altcoin forming a bottom and rallying are high.
Earnings beat triggers Nike to spike 9%

Nike (NKE) stock has surged over 9% in Friday’s premarket, climbing above $98 per share, following late Thursday’s fiscal first-quarter earnings release. Nike beat pessimistic earnings expectations by more than 23% and hiked its dividend by 9%.