NEM Elliott Wave technical forecast [Video]
![NEM Elliott Wave technical forecast [Video]](https://editorial.fxsstatic.com/images/i/Economic-Indicator_Recession-5_XtraLarge.png)
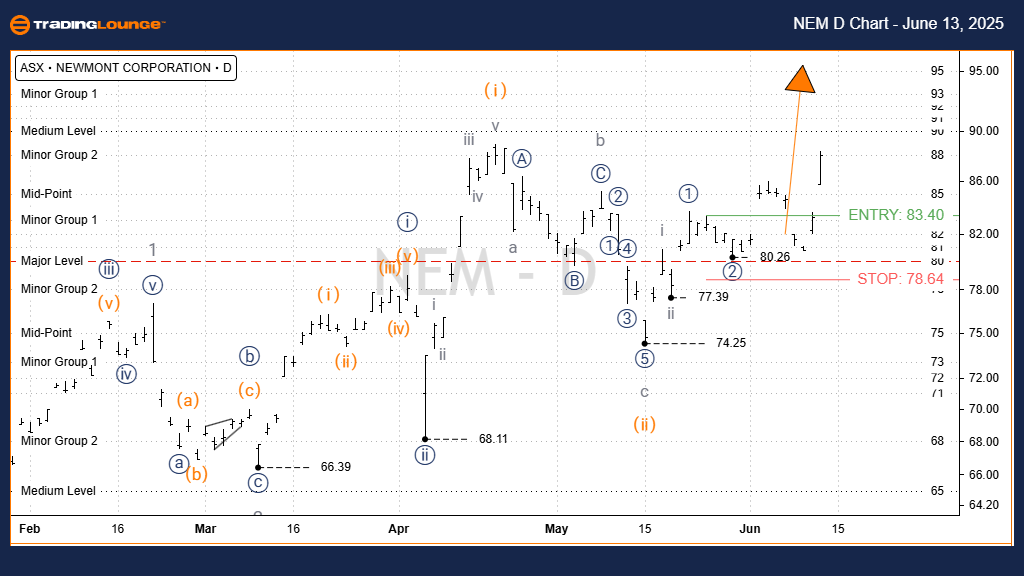
NEM Elliott Wave technical analysis
Today’s Elliott Wave analysis focuses on the Australian Stock Exchange’s listing of Newmont Corporation (ASX: NEM). We observe the stock advancing in a strong third wave. This technical forecast outlines key targets and identifies invalidation points that signal either the continuation or end of the current bullish trend.
-
Function: Major trend (Minor degree, grey).
-
Mode: Motive.
-
Structure: Impulse.
-
Position: Wave iii) orange of Wave iii)) navy of Wave 3 grey.
Details:
Wave ii) (orange) likely concluded at 74.25 after a classic zigzag (a-b-c, grey). Following that low, wave iii) (orange) began an upward movement, aiming for a projected target of approximately 100.00.
-
Invalidation point: 74.25
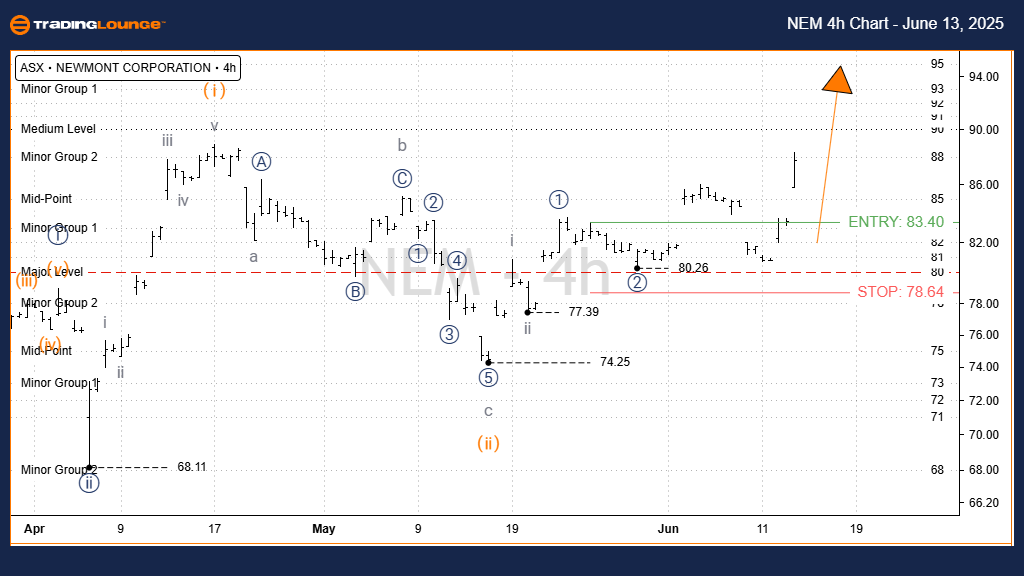
NEM Elliott Wave technical analysis
This section reinforces the 1D analysis. The 4-hour chart shows consistency with the daily chart as wave iii) (orange) continues upward. Our immediate focus is the short-term movement of wave iii (grey) targeting 90.00, before it moves toward the longer-term 100.00.
-
Function: Major trend (Minor degree, grey).
-
Mode: Motive.
-
Structure: Impulse.
-
Position: Wave iii) orange of Wave ((iii)) navy of Wave 3 grey.
-
Invalidation Point: 74.25.
Conclusion
This technical outlook for ASX: NEWMONT CORPORATION (NEM) provides insights into the current price action and strategic entry/exit levels. Key validation points help confirm wave progression, boosting analysis confidence. By delivering objective wave-based forecasts, our goal is to help traders recognize opportunities aligned with larger trend patterns.
NEM Elliott Wave technical analysis [Video]
Author

Peter Mathers
TradingLounge
Peter Mathers started actively trading in 1982. He began his career at Hoei and Shoin, a Japanese futures trading company.


