NEM Elliott Wave technical forecast [Video]
![NEM Elliott Wave technical forecast [Video]](https://editorial.fxsstatic.com/images/i/General-Stocks_1.png)
NEM Elliott Wave technical analysis
Today's Elliott Wave analysis focuses on the Australian Stock Exchange (ASX) stock NEWMONT CORPORATION (NEM). Our analysis identifies an upside potential in ASX:NEM shares and provides key price levels to monitor for potential trend shifts.
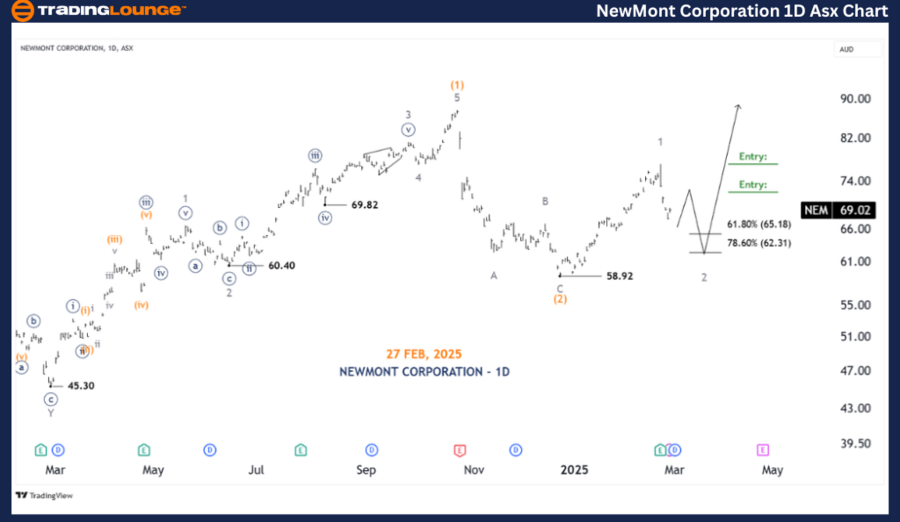
NEWMONT CORPORATION (NEM) – Elliott Wave Technical Analysis (1D Chart - Semilog Scale).
-
Function: Major trend (Intermediate degree, orange).
-
Mode: Motive.
-
Structure: Impulse.
-
Position: Wave 2 - grey of Wave (3) - orange.
Details:
Wave (2) - orange appears to have completed a Zigzag correction around 58.92, signaling a potential move toward Wave (3) - orange. If this scenario plays out, Wave (3) - orange is likely extending into wave 1,2 - grey. Once Wave 2 - grey completes, we will look for confirmation of renewed bullish momentum leading into Wave 3 - grey.
-
Invalidation point: 58.92.
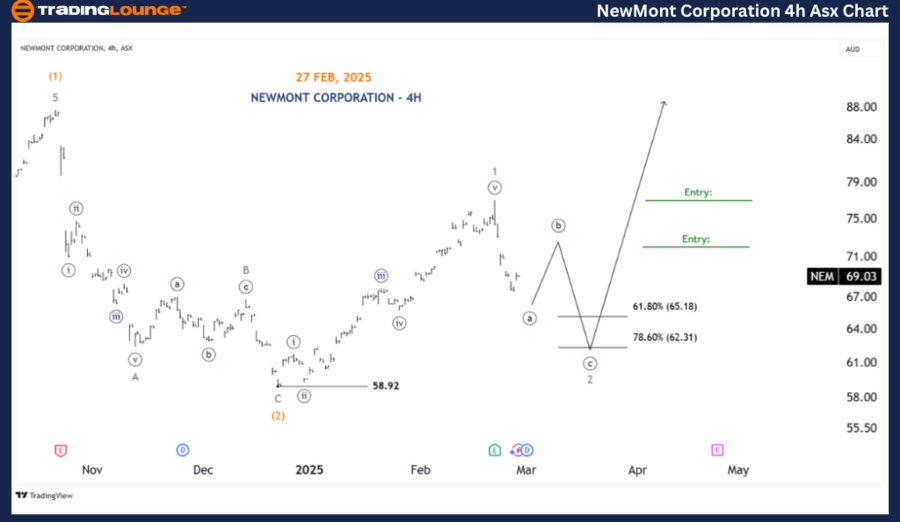
NEWMONT CORPORATION (NEM) – Elliott Wave technical analysis (Four-hour chart)
-
Function: Major trend (Minor degree, grey).
-
Mode: Motive.
-
Structure: Impulse.
-
Position: Wave ((a)) - navy of Wave 2 - grey.
Details:
A closer look at ASX:NEM reveals that Wave 1 - grey has completed at 59.92, and the price is currently forming Wave 2 - grey. This corrective move is developing into a Zigzag labeled ((a))((b))((c)) - navy, with a projected decline toward 65.18 - 62.31.
Once Wave 2 - grey ends, potential long entry points will emerge, particularly at the completion of Wave ((b)) - navy, leading into Wave 3 - grey. However, if the price falls below 62.31, caution is advised as the forecast's reliability weakens, requiring a reassessment of market conditions.
-
Invalidation point: 58.92.
Conclusion
Our Elliott Wave analysis of NEWMONT CORPORATION (NEM) on ASX highlights potential price movements and key validation/invalidation levels. By identifying support and resistance zones, traders can leverage these insights to refine their strategies. The provided wave count and price projections serve to enhance confidence in trend direction while offering a professional and data-driven perspective.
Technical analyst: Hua (Shane) Cuong, CEWA-M (Master’s Designation).
NEM Elliott Wave technical analysis [Video]
Author

Peter Mathers
TradingLounge
Peter Mathers started actively trading in 1982. He began his career at Hoei and Shoin, a Japanese futures trading company.