|

Natural Gas Price Analysis: XNG/USD retreats towards $2.24 within immediate bearish channel

  • Natural Gas price fades bounce off the lowest levels since August 2020.
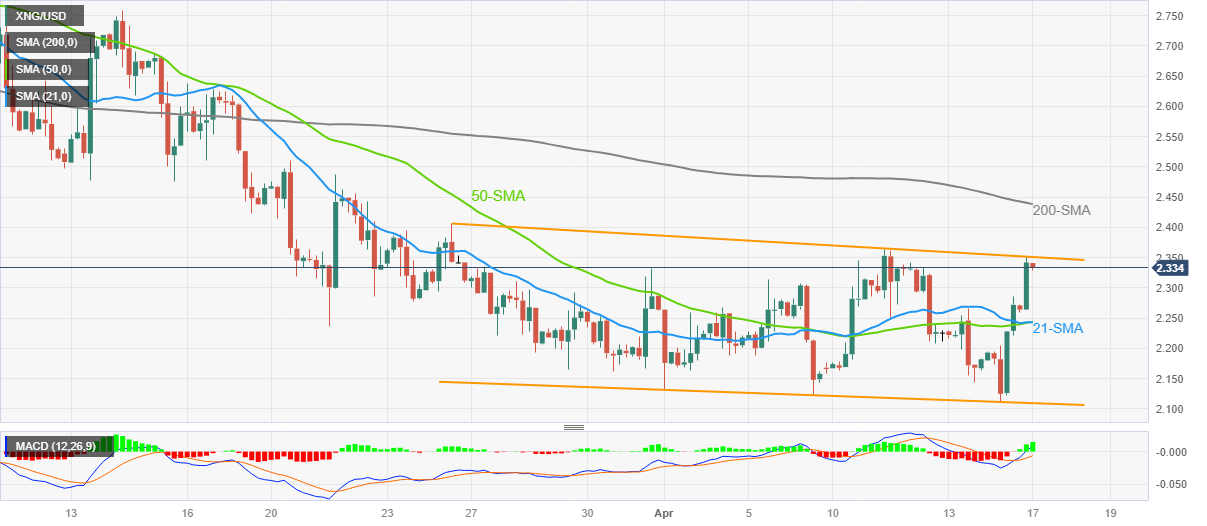
  • Three-week-old bearish channel, 200-SMA prods XNG/USD’s corrective bounce.
  • Bullish MACD signals, short-term SMA confluence puts a floor under the Natural Gas price.

Natural Gas (XNG/USD) price pares intraday gains around $2.33 during early Monday. In doing so, the energy asset eases from an upper line of the three-week-old bearish channel.

However, the bullish MACD signals, as well as a convergence of the 21-SMA and 50-SMA, around $2.24, restrict the immediate downside of the XNG/USD.

In a case where the Natural Gas price drops below $2.24, the stated channel’s support around $2.11, will be crucial to watch as it becomes the fresh low since August 2020 from which the XNG/USD previously bounced.

Should the quote remains bearish past $2.11, the odds of witnessing a slump toward the $2.00 round figure can’t be ruled out. However, the July 2020 high surrounding $1.95 could challenge the Natural Gas bears afterward.

On the flip side, a clear break of the stated channel’s top line, close to $2.35, isn’t an open invitation to the XNG/USD bulls as the 200-SMA hurdle of near $2.44 can act as the final defense of the Natural Gas bears.

Even if the commodity price remains firmer past $2.44, the mid-March swing low around $2.48 and the $2.50 round figure can act as additional upside filters before giving control to the Natural Gas buyers.

Natural Gas Price: Four-hour chart

Trend: Limited downside expected

Author

Anil Panchal

Anil Panchal

FXStreet

Anil Panchal has nearly 15 years of experience in tracking financial markets. With a keen interest in macroeconomics, Anil aptly tracks global news/updates and stays well-informed about the global financial moves and their implications.

More from Anil Panchal
Share:

Editor's Picks

EUR/USD keeps the offered stance just above 1.1700

EUR/USD is coming under heavy selling pressure in what has been a rather grim start to the new trading week, with the pair now trading close to the 1.1700 support area as the US Dollar stages a solid rebound. The prevailing flight to safety mood continues to favour the Greenback, as investors react to the escalating conflict in the Middle East and trim risk exposure across the board.

GBP/USD hits new yearly lows near 1.3300

GBP/USD adds to the recent bearish tone, approaching to the key 1.3300 support to reach fresh YTD troughs against the backdrop of the robust performance of the US Dollar. Indeed, Cable’s decline comes amid the firm demand for the safe-haven space in the wake of the US and Israel attacks to Iran.

Gold trims losses, back below $5,400

Gold now surrenders part of the earlier advance past the $5,400 mark per troy ounce at the beginning of the week. Indeed, the precious metal’s strong uptick remains fuelled by increasing geopolitical tensions in the Middle East amid the intense demand for safer assets.

Bitcoin on brink of breakdown amid US-Iran war

Bitcoin (BTC) remains under pressure near the key support level of $65,700. Trading at $66,400 at the time of writing on Monday, a breakdown below this critical level would suggest a deeper correction ahead.

The Fed is finally talking about AI – Here's why it matters for the US Dollar

AI is moving from earnings calls into the heart of monetary policy discussions, forcing Federal Reserve officials to confront a new question: How to act if AI reshapes inflation, employment and interest rates at the same time?

Grass 20% bullish breakout defies broader market weakness

Grass (GRASS) is edging up above $0.30 at the time of writing on Monday. The token’s notable 20% intraday surge stands out amid heightened volatility in the broader crypto market.