|

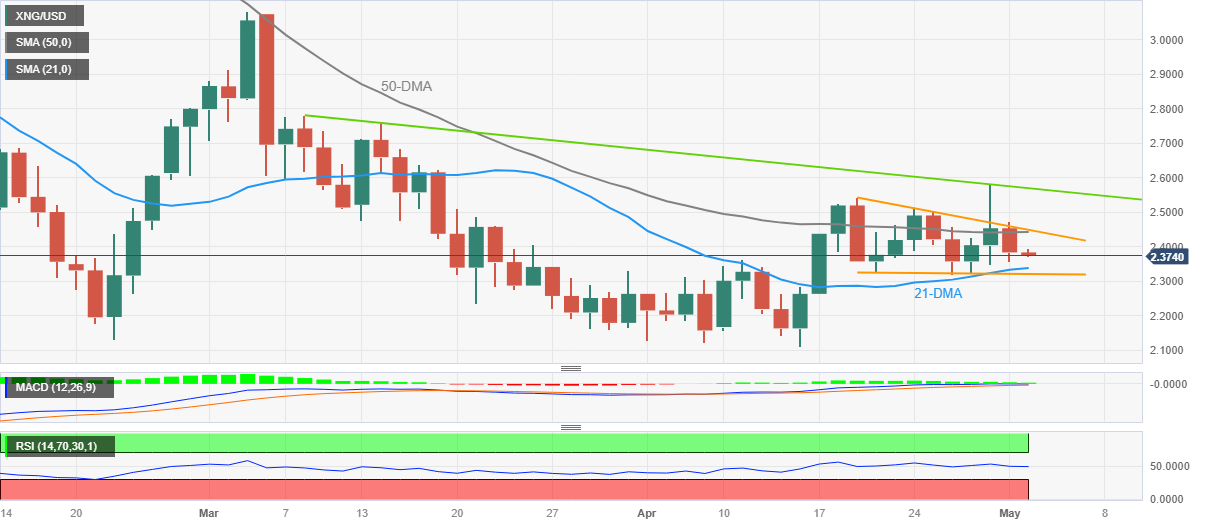
Natural Gas Price Analysis: XNG/USD drops to $2.37 within nearby descending triangle

  • Natural Gas price remains pressured after snapping two-day winning streak.
  • 50-DMA adds strength to $2.45 upside hurdle, 21-DMA acts as additional support.
  • Sluggish oscillators suggest continuation of further XNG/USD grind within bullish chart formation.

Natural Gas Price (XNG/USD) holds lower grounds near $2.37 during the early hours of Tuesday, after posting the first daily loss in three the previous day.

In doing so, the XNG/USD price remains inside a two-week-old descending triangle formation amid sluggish MACD signals and steady RSI (14).

As a result, the Natural Gas Price is likely to remain sideways within a bullish chart pattern, currently between $2.45 and $2.32. That said, the 50-DMA adds strength to the $2.45 upside hurdle.

It’s worth noting that an upside break of $2.45 won’t hesitate to challenge a downward-sloping resistance line from March 08, close to $2.57. Following that, the six-week high marked on Friday at around $2.58 can act as the last defense of the Natural Gas sellers.

On the contrary, the 21-DMA level of around $2.33 restricts the immediate downside of the XNG/USD price before directing the energy instrument towards the bottom of the stated triangle, near $2.32.

Should the quote remains bearish past $2.32, the yearly low marked in April around $2.11 and the $2.00 psychological magnet will gain the market’s attention.

Overall, the Natural Gas Price remains on the bull’s radar despite the latest pullback in the quote.

Natural Gas Price: Daily chart

Trend: Further consolidation expected

Author

Anil Panchal

Anil Panchal

FXStreet

Anil Panchal has nearly 15 years of experience in tracking financial markets. With a keen interest in macroeconomics, Anil aptly tracks global news/updates and stays well-informed about the global financial moves and their implications.

More from Anil Panchal
Share:

Editor's Picks

GBP/USD clings to daily gains near 1.3350

GBP/USD holds just in positive territory around 1.3350 on Friday as the Greenback keeps a vacillating price action. With Fed rate hike expectations easing and US markets closed for the Independence Day holiday, Cable remains on track to post solid weekly gains.

EUR/USD remains sidelined around 1.1440

EUR/USD holds on to its recent gains and consolidates around 1.1440 at the end of the week as the US Dollar lacks clear direction. In the meantime, trading conditions remain subdued, with volatility constrained by the closure of US markets for the Independence Day holiday.

Gold flirts with two-week highs, targets $4,200

Gold extends its recovery for a third straight day, advancing toward the $4,200 mark per troy ounce on Friday. The precious metal looks set to snap a four-week losing streak as softer-than-expected June US NFP data prompt investors to scale back expectations of further Fed tightening.

Crypto Today: Bitcoin, Ethereum, XRP advance amid renewed capital inflows

Bitcoin maintains its upward momentum, holding above the $61,000 mark at the time of writing on Friday. Major altcoins such as Ethereum and Ripple are also posting gains, signaling a modest uptick in market sentiment and renewed risk appetite among investors.

The Iran war failed to trigger a recession. Can the US economy keep defying expectations?

Nearly four months after the start of the Iran war, the US economy remains remarkably resilient. While the conflict initially triggered a severe disruption to global energy markets and a sharp rise in Oil prices, recent diplomatic progress between Washington and Tehran has eased concerns about a prolonged supply shock.

Kevin Warsh offers no policy clues: Why markets still got their answer

Financial markets came to Sintra looking for clues about the Federal Reserve's (Fed) next move. They largely left with confirmation that Fed Chair Kevin Warsh intends to make those clues much harder to find.