|

Natural Gas Price Analysis: XNG/USD bulls approach $2.48 resistance confluence

  • Natural Gas cheers upside break of two-month-old resistance at a fortnight high.
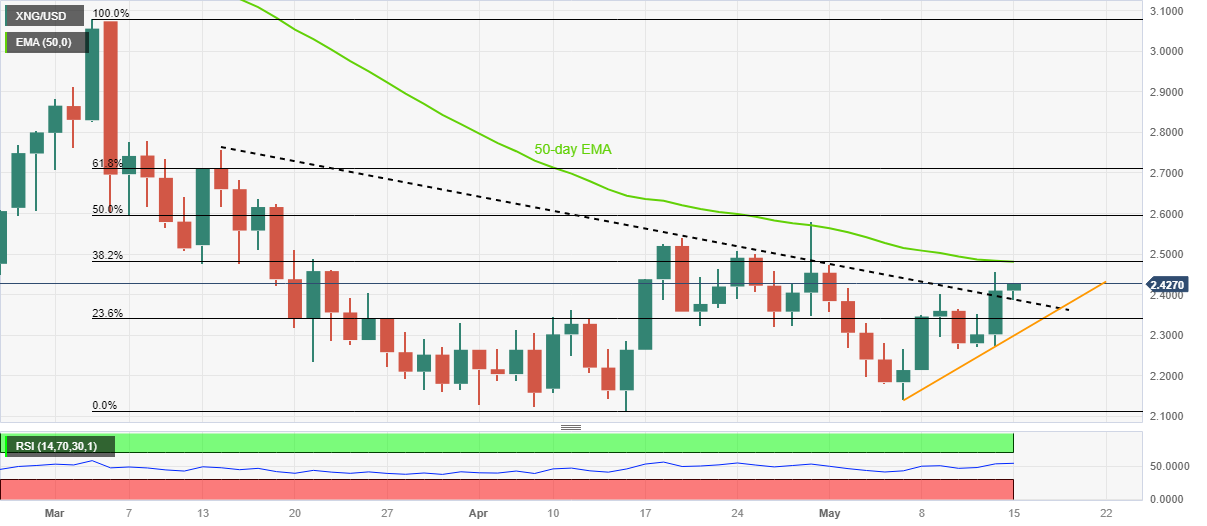
  • Convergence of 50-day EMA, 38.2% Fibonacci retracement of March-April downside appears a tough nut to crack for XNG/USD bulls.
  • Ascending support line from May 05 adds to the downside filters for the Natural Gas price.

Natural Gas Price (XNG/USD) remains firmer around $2.42, up for the third consecutive day while flirting with the highest levels in two weeks during early Monday in Europe.

In doing so, the energy instrument cheers the previous day’s sustained break of a downward-sloping resistance line from mid-March, now immediate support near $2.38.

Adding strength to the bullish bias is the RSI (14) line that stays firmer around the 50.00 level, suggesting a continuation of the upward grind.

However, the 50-day Exponential Moving Average (EMA) and 38.2% Fibonacci retracement level of the XNG/USD’s downside from early March to mid-April, near $2.48 at the latest, could challenge the Natural Gas bulls.

In a case where the commodity price manages to provide a daily close beyond $2.48, the odds of witnessing a run-up beyond the previous monthly high of nearly $2.58 can’t be ruled out.

On the contrary, the resistance-turned-support line from March, near $2.38, restricts the immediate downside of the Natural Gas price.

Following that, an upward-sloping trend line from May 05, close to $2.30 by the press time, appears crucial to watch for the XNG/USD bears to watch as a break of which could give back control to them.

Natural Gas Price: Daily chart

Trend: Further upside expected

Author

Anil Panchal

Anil Panchal

FXStreet

Anil Panchal has nearly 15 years of experience in tracking financial markets. With a keen interest in macroeconomics, Anil aptly tracks global news/updates and stays well-informed about the global financial moves and their implications.

More from Anil Panchal
Share:

Markets move fast. We move first.

Orange Juice Newsletter brings you expert driven insights - not headlines. Every day on your inbox.

By subscribing you agree to our Terms and conditions.

Editor's Picks

EUR/USD holds around 1.1750 after weak German and EU PMI data

EUR/USD maintains its range trade at around 1.1750 in European trading on Tuesday. Weaker-than-expected December PMI data from Germany and the Eurozone make it difficult for the Euro to find demand, while investors refrain from taking large USD positions ahead of key employment data.

GBP/USD climbs above 1.3400 after upbeat UK PMI data

GBP/USD gains traction and trades in positive territory above 1.3400 on Tuesday as the British Pound benefits from upbeat PMI data. Later in the day, crucial data releases from the US, including Nonfarm Payrolls, Retail Sales and PMI, could trigger the next big action in the pair.

Gold retreats from seven week highs on profit-taking; all eyes on US NFP release

Gold price loses momentum below $4,300 during the early European trading hours on Tuesday, pressured by some profit-taking and weak long liquidation from the shorter-term futures traders. Furthermore, optimism around Ukraine peace talks could weigh on the safe-haven asset like Gold.

US Nonfarm Payrolls expected to point to cooling labor market in November

The United States Bureau of Labor Statistics will release the delayed Nonfarm Payrolls (NFP) data for October and November on Tuesday at 13:30 GMT. Economists expect Nonfarm Payrolls to rise by 40,000 in November. The Unemployment Rate is likely to remain unchanged at 4.4% during the same period.

NFP preview: Complex data release will determine if Fed was right to cut rates

The long wait is over, and the Bureau of Labor Statistics in the US will release nonfarm payrolls reports for both November and October at 1330 GMT on Tuesday. The overall NFP figure for October is expected to be -10k, however, it is expected to be influenced by a massive 130k drop in federal department workers. 

BNB Price Forecast: BNB slips below $855 as bearish on-chain signals and momentum indicators turn negative

BNB, formerly known as Binance Coin, continues to trade down around $855 at the time of writing on Tuesday, after a slight decline the previous day. Bearish sentiment further strengthens as BNB’s on-chain and derivatives data show rising retail activity.