|

Natural Gas Price Analysis: XNG/USD bears need to break $2.62 for conviction

  • Natural Gas Price stays depressed at weekly low after breaking fortnight-old support line.
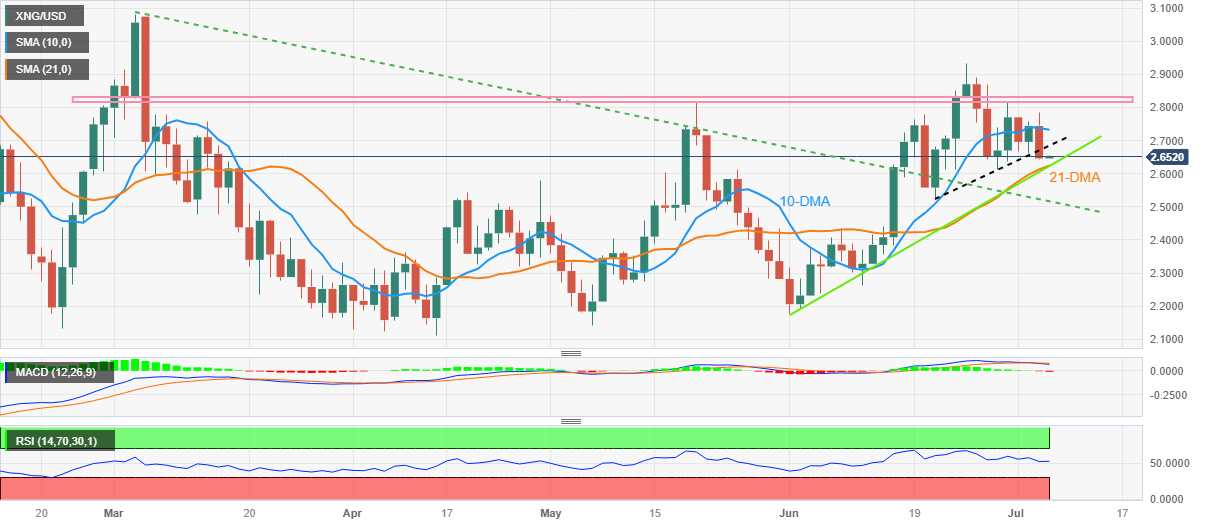
  • Convergence of 21-DMA, ascending trend line from early June challenges XNG/USD sellers.
  • Bearish MACD signals, U-turn from 10-DMA and near 50.0 RSI suggest further downside of the Natural Gas Price.
  • Multiple hurdles stand tall to challenge XNG/USD rebound.

Natural Gas Price (XNG/USD) remains pressured at a weekly low despite making rounds to $2.65 during the early hours of Thursday’s Asian session.

The XNG/USD Price refreshed its weekly bottom after breaking a two-week-old rising support line, now immediate resistance around $2.68. In doing so, the energy instrument not only reversed from the 10-DMA but also marked the biggest daily loss in a week.

In addition to the trend line break, the bearish MACD signal and the near 50.0 conditions of the RSI (14) line, also keep the Natural Gas bears hopeful.

However, a convergence of the 21-DMA and an upward-sloping trend line from June 01 challenges the XNG/USD bears around $2.62, a break of which won’t hesitate to drag the quote toward a four-month-old previous resistance line, close to $2.51 at the latest.

It should be noted that the Natural Gas bear’s dominance past $2.51 will offer a free hand to sellers trying to revisit the early June swing high of around $2.43.

Alternatively, an upside break of the support-turned-resistance line, near $2.68 by the press time, will need validation from the 10-DMA hurdle of around $2.73 to convince the Natural Gas buyers.

Even so, a horizontal area comprising multiple levels marked since early March, between $2.81 and $2.83, appears a tough nut to crack for the XNG/USD bulls before retaking control.

Natural Gas Price: Daily chart

Trend: Further downside expected

Author

Anil Panchal

Anil Panchal

FXStreet

Anil Panchal has nearly 15 years of experience in tracking financial markets. With a keen interest in macroeconomics, Anil aptly tracks global news/updates and stays well-informed about the global financial moves and their implications.

More from Anil Panchal
Share:

Editor's Picks

AUD/USD consolidates above 0.7000/two-month low; bearish potential intact

The AUD/USD pair oscillates in a narrow range during the Asian session, and moves little following the release of mixed inflation figures from China. Spot prices currently trade around the 0.7025 region, nearly unchanged for the day, and remain within striking distance of a nearly two-month low set on Tuesday. Renewed hostilities between the US and Iran temper hopes for a deal to end the over three-month-old war.

Japanese Yen languishes despite wholesale inflation accelerates in May

USD/JPY flatlines after experiencing volatility, trading around 160.40 during the Asian hours on Wednesday. The pair continues to hold its ground, reflecting a struggling Japanese Yen that has failed to find support despite a massive acceleration in wholesale inflation. Driven by surging energy costs linked to the ongoing Middle East conflict, Japan’s Producer Price Index jumped 6.3% year-over-year in May. This hot printing comfortably outpaced April’s upwardly revised 5.3% figure and surpassed market consensus of 5.5%, marking the fastest pace of wholesale price growth in three years.

Gold languishes near March low, below $4,200 as traders await US CPI report

Gold maintains its heavily offered tone through the first half of the European session and currently trades near its lowest level since March 23, around the $4,180-$4,175 region. Renewed hostilities between the US and Iran fuel inflationary concerns and bolster bets for more hawkish central banks, driving flows away from the non-yielding yellow metal. The decline could also be attributed to technical selling following the recent breakdown below the very important 200-day SMA and seems unaffected by a softer US Dollar, which tends to benefit the commodity.

Cardano's downtrend deepens despite on-chain bottoming signals

Cardano edges lower to $0.1600 signaling a potential extension of the 30% loss from last week. The altcoin remains under intense selling pressure, weighing on its retail support. Still, a spike in dormant supply re-entering circulation signals that the selling pressure has run its course, a pattern that often precedes a rebound.

US CPI data set to show inflation at three-year high in May, backing Fed hawkish tilt

The US Bureau of Labor Statistics will publish the May Consumer Price Index (CPI) data on Wednesday. The report is expected to show another step up in consumer inflation, driven by the persistently high Oil prices due to the ongoing crisis in the Middle East.

The US economy defies the rules: 100 days into the Oil shock and the recession signal is still missing

More than three months after the start of the Iran war and the resulting disruption to global energy markets, the US economy continues to display remarkable resilience. The conflict has triggered a sharp rise in Oil prices, reignited inflationary pressures and fueled widespread concerns about a potential economic slowdown.