Natural Gas Price Analysis: XNG/USD bears flex muscles near $2.30
- Natural Gas price holds lower ground within four-day-old symmetrical triangle.
- Sustained trading below the key EMAs, downbeat oscillators keep XNG/USD sellers hopeful.
- Clear break of $2.30 becomes necessary to aim for multi-month low marked in February.
- Buyers need a successful break of $2.50 to retake control.

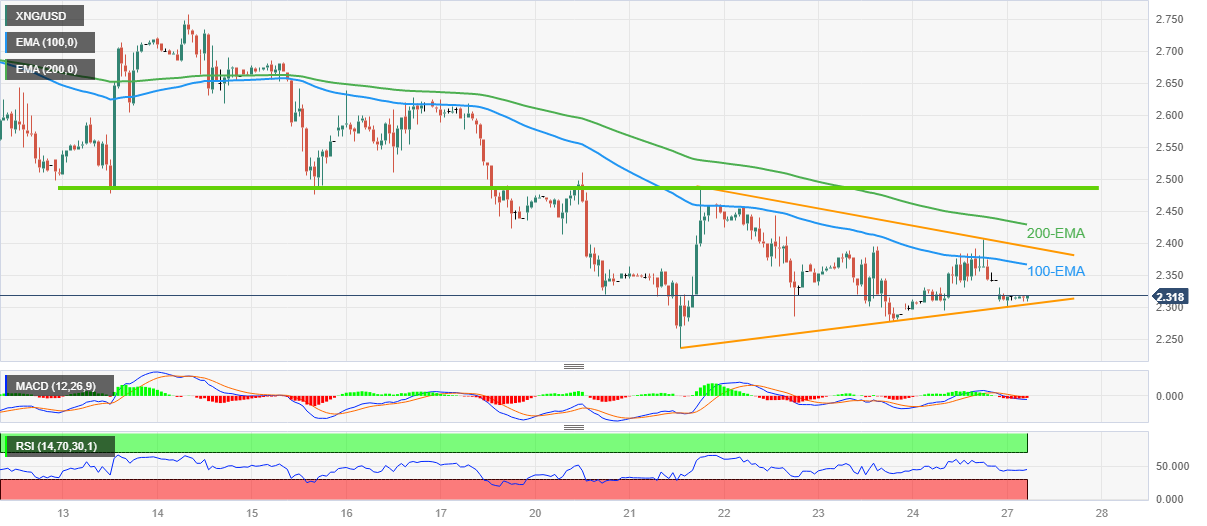
Natural Gas (XNG/USD) price remains on the back foot around $2.31 as bears take a breather after a three-week losing streak inside a short-term symmetrical triangle.
Despite the commodity’s latest inaction, the quote’s placement below the key Exponential Moving Averages (EMA) and a two-week-old horizontal resistance keep the bears hopeful.
Also favoring the sellers could be the bearish MACD signals and the steady RSI (14) suggesting the continuation of the downturn established in late 2022.
It’s worth noting, however, that the aforementioned triangle’s lower line, around $2.30 by the press time, restricts the immediate downside of the XNG/USD.
Following that, the previous weekly low of around $2.23 may act as an intermediate halt before directing the Natural Gas bears toward the 31-month low marked in February at around $2.13.
On the flip side, the 100-EMA restricts the immediate upside of the XNG/USD near $2.36, a break of which highlights the top line of the four-day-long symmetrical triangle, near $2.40.
Even if the Natural Gas price defies the triangle formation by crossing the $2.40 hurdle, the 200-EMA and a fortnight-old horizontal resistance, respectively near $2.43 and $2.50, could challenge the bulls.
Overall, Natural Gas remains on the bear’s radar even if the immediate triangle restricts the short-term downside of the commodity.
Natural Gas Price: Hourly chart
Trend: Bearish
Author

Anil Panchal
FXStreet
Anil Panchal has nearly 15 years of experience in tracking financial markets. With a keen interest in macroeconomics, Anil aptly tracks global news/updates and stays well-informed about the global financial moves and their implications.


