Natural Gas locks in gains and closes week off in the green
- Natural Gas price are rallying on the back of surging demand in the Middle East.
- Several African and Middle Eastern countries use Gas to power air conditioning.
- The US Dollar Index slips further, barely holding above 105.00.

Natural Gas (XNG/USD) prices are heading, in the Nonfarm Payrolls aftermath, higher for a second consecutive day driven by a pickup in demand from the Middle East and some North African countries. The best example is Egypt, where Gas exports have already decreased to meet local demand. The need for Gas is growing because of the usage of Liquified Natural Gas (LNG) to power air conditioning units amid an ongoing heatwave w in the region.
Meanwhile, the US Dollar Index (DXY) is slipping further below the 105.00 marker after the US Nonfarm Payrolls print. The number was still a positive 175,000, though looked rather bleak against the previous 315,000 and missed estimates. With the dust settling, the US Dollar traded at several nice buy-levels against the Euro and the Japanese Yen and could head into profit in the coming days and weeks.
Natural Gas is trading at $2.18 per MMBtu at the time of writing.
Natural Gas news and market movers: Tightness in the gas market
- The biggest winner from Europe’s shift away from Russian Gas is Qatar. The kingdom is ramping up its production and expanding its mining of LNG to fulfill fresh demand.
- Gazprom, the Russian biggest Gas company, reported a $7 billion loss after diminishing flows to Europe and with Asian demand not enough to fill the void, the Financial Times reports.
- The US is set to lose Gas inflows from Canada as the country is set to unveil its own LNG export terminal.
- The recent lower Gas prices were becoming an issue for ConocoPhillips, which missed earnings estimates in the first quarter of this year, Dow Jones reports.
Natural Gas Technical Analysis: Ceasefire talks are the biggest catalyst here
Natural Gas has jumped back above $2.11, which remains a firm line in the sand. With plenty of false breaks in recent weeks around this level, the main question is whether the hot weather in the Middle East is substantial enough to push prices higher. As with these elements, rallies are likely to be very short-lived and Gas prices are soon to retreat below $2.11 again once the temperatures are mildening again.
On the upside, the blue line at $2.11, the 2023 low, and the 100-day Simple Moving Average (SMA) at $2.10 are still to be considered, seeing the several false breakouts during the recent weeks. Further up, the next level to watch is the January 25 high at $2.33 before looking at the 200-day SMA at $2.54.
On the other side, the $2.00 handle has worked as nearby support for now. Further down, a trifecta of support is formed at $1.88, with the ascending and descending trend lines crossing and the 55-day SMA. Should that level break, expect a quick downward movement to the year-to-date low at $1.60.
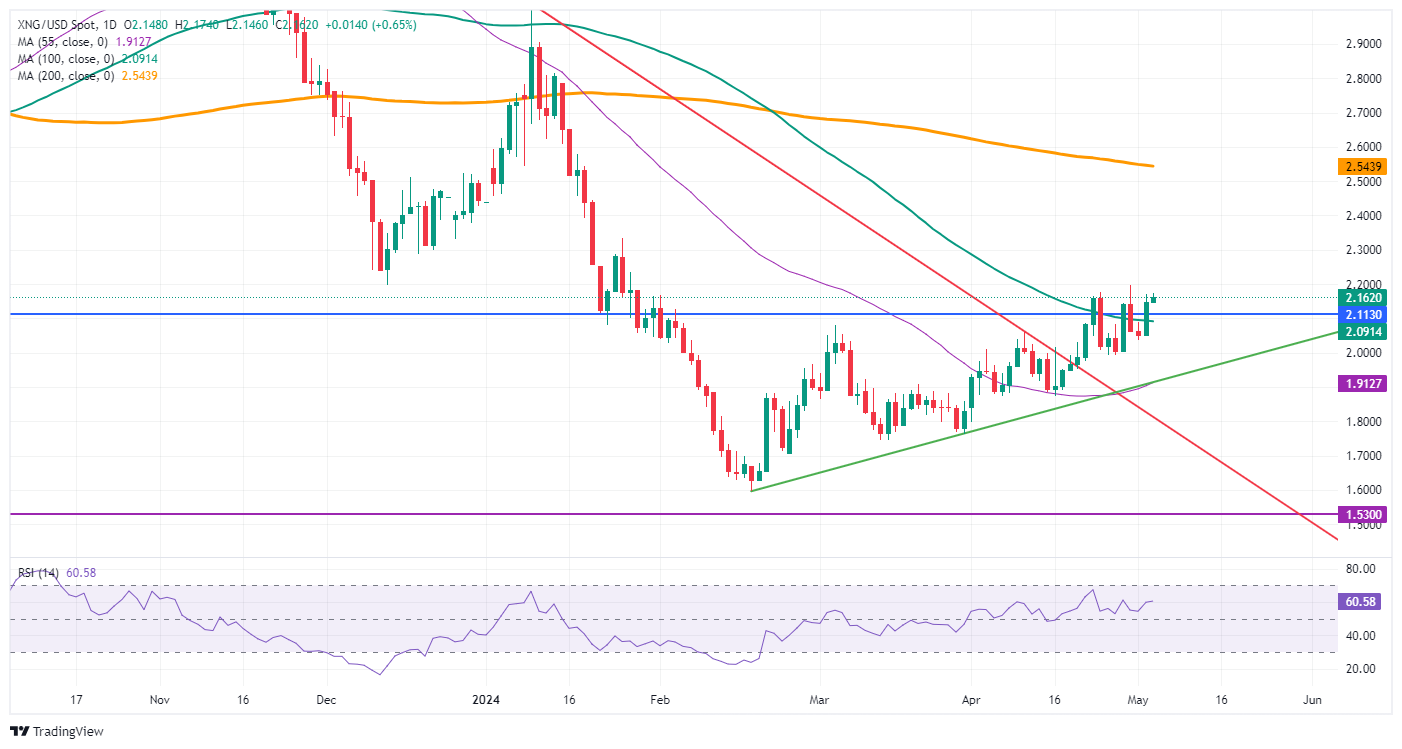
Natural Gas: Daily Chart
Natural Gas FAQs
Supply and demand dynamics are a key factor influencing Natural Gas prices, and are themselves influenced by global economic growth, industrial activity, population growth, production levels, and inventories. The weather impacts Natural Gas prices because more Gas is used during cold winters and hot summers for heating and cooling. Competition from other energy sources impacts prices as consumers may switch to cheaper sources. Geopolitical events are factors as exemplified by the war in Ukraine. Government policies relating to extraction, transportation, and environmental issues also impact prices.
The main economic release influencing Natural Gas prices is the weekly inventory bulletin from the Energy Information Administration (EIA), a US government agency that produces US gas market data. The EIA Gas bulletin usually comes out on Thursday at 14:30 GMT, a day after the EIA publishes its weekly Oil bulletin. Economic data from large consumers of Natural Gas can impact supply and demand, the largest of which include China, Germany and Japan. Natural Gas is primarily priced and traded in US Dollars, thus economic releases impacting the US Dollar are also factors.
The US Dollar is the world’s reserve currency and most commodities, including Natural Gas are priced and traded on international markets in US Dollars. As such, the value of the US Dollar is a factor in the price of Natural Gas, because if the Dollar strengthens it means less Dollars are required to buy the same volume of Gas (the price falls), and vice versa if USD strengthens.
Author

Filip Lagaart
FXStreet
Filip Lagaart is a former sales/trader with over 15 years of financial markets expertise under its belt.


