Natural Gas set for dull session at $1.90 while markets await Israel's next step
- Natural Gas prices are not moving on Wednesday but futures on European markets jump.
- Markets see tensions lingering amid uncertainty about Israel’s retaliation against Iran.
- The US Dollar Index consolidates after Fed Chairman Powell confirms delay in interest-rate cuts.

Natural Gas (XNG/USD) trades sideways in a near flat rate on Wednesday, digesting the overnight headlines that came out about lingering tensions in the Middle East. White House National Security Advisor Jake Sullivan said to Bloomberg that the outline of the sanctions against Iran will come in the following days and will specifically target the country’s drone plan. Meanwhile, in the Middle East, Saudi Arabia’s Crown Prince Mohammed Bin Salman and UAE President Mohammed Bin Zayed Al Nahyan issued a rare joint statement calling for self-restraint and pointed to the dangers of war.
Meanwhile, the US Dollar Index (DXY) is weakening after its staggering five-day winning streak. Some further easing is in the cards with a very light economic calendar ahead and markets no longer looking to force the US Federal Reserve to change its stance. US Federal Reserve Chairman Jerome Powell said on Tuesday that current inflation levels do not call for a rate cut, suggesting that interest rates will stay steady for longer until inflation comes down.
Natural Gas is trading at $1.90 per MMBtu at the time of writing.
Natural Gas news and market movers: Headlines not there
- The Barrow North LNG terminal in the United kingdom is undergoing an unplanned maintenance call. Meanwhile, Gas flows from Norway to Europe are recovering after a series of unforeseen outages at some of its major fields.
- Local European Gas Futures have risen by 20% in just five days. Prices are likely to ease, though, as Norwegian flows pick up to normal volumes again. For now the rally has halted with the Relative Strength Index (RSI) entering overbought area.
- European Gas storages are filled up by 62% and are set to get refueled over the summer period.
- Headline risks are still in the balance on Wednesday as markets await details over Israel’s retaliatory measures against Iran.
- US Rockies Natural Gas Production falls near 2.6%, according to Bloomberg.
Natural Gas Technical Analysis: Thin equilibrium
Natural Gas prices are in a soft patch on Wednesday, for as long as no clear headlines out of Israel hit the wires on what the next steps will be on Iran. The breather should give prices some room for a small retrace, though nothing substantial. With headline risk at hand, expect the main support barriers to remain unchallenged.
On the upside, the red descending trend line at $1.99-$2.00 looks ready for another test. Should Gas prices snap above it, a quick rally to $2.11 could be seen. Not that far off, $2.15 in the form of the 100-day Simple Moving Average (SMA) becomes the main resistance level.
On the downside, the 55-day SMA around $1.88 should be a safety net. Next, the green ascending trend line near $1.83 should support the rally since mid-February. Should even that level break, a dive to $1.60 and $1.53 would not be impossible.
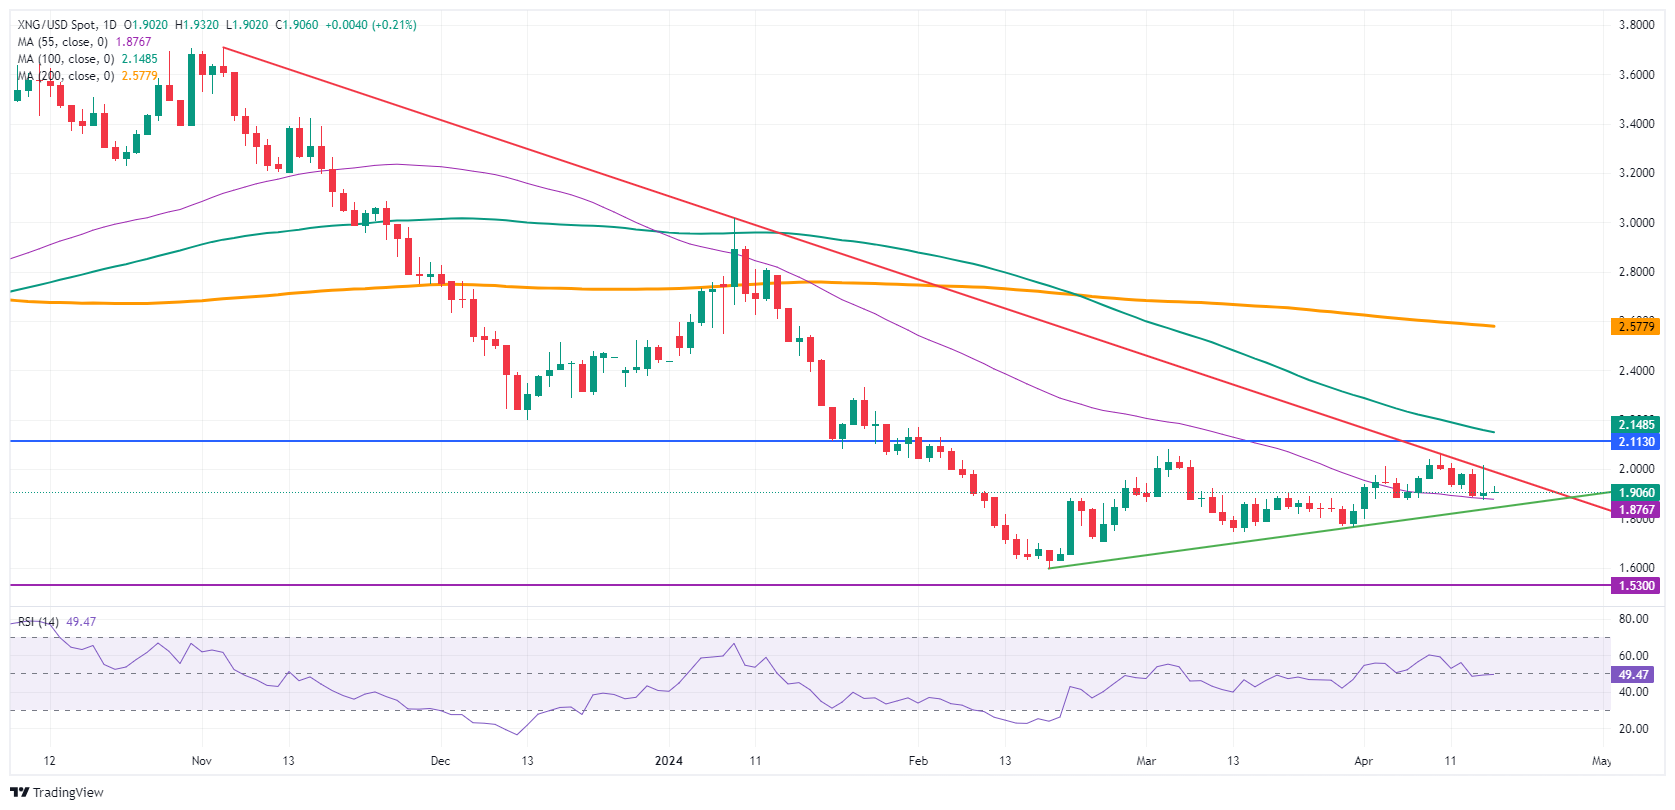
Natural Gas: Daily Chart
Natural Gas FAQs
Supply and demand dynamics are a key factor influencing Natural Gas prices, and are themselves influenced by global economic growth, industrial activity, population growth, production levels, and inventories. The weather impacts Natural Gas prices because more Gas is used during cold winters and hot summers for heating and cooling. Competition from other energy sources impacts prices as consumers may switch to cheaper sources. Geopolitical events are factors as exemplified by the war in Ukraine. Government policies relating to extraction, transportation, and environmental issues also impact prices.
The main economic release influencing Natural Gas prices is the weekly inventory bulletin from the Energy Information Administration (EIA), a US government agency that produces US gas market data. The EIA Gas bulletin usually comes out on Thursday at 14:30 GMT, a day after the EIA publishes its weekly Oil bulletin. Economic data from large consumers of Natural Gas can impact supply and demand, the largest of which include China, Germany and Japan. Natural Gas is primarily priced and traded in US Dollars, thus economic releases impacting the US Dollar are also factors.
The US Dollar is the world’s reserve currency and most commodities, including Natural Gas are priced and traded on international markets in US Dollars. As such, the value of the US Dollar is a factor in the price of Natural Gas, because if the Dollar strengthens it means less Dollars are required to buy the same volume of Gas (the price falls), and vice versa if USD strengthens.
Author

Filip Lagaart
FXStreet
Filip Lagaart is a former sales/trader with over 15 years of financial markets expertise under its belt.


