NASDAQ100: Has the next leg lower started?

For those new to our work, we primarily use the Elliott Wave Principle (EWP) to forecast the financial markets, such as the NASDAQ100 (NDX). The EWP allows us to identify the path the market can most likely take based on known patterns, which must adhere to specific price-based rules.
Our previous update from two weeks ago showed our preferred path was for a (retracement) rally back to ideally $19300-800. See the red box (target zone) in Figure 1 below. Fast-forward, and so far, the index peaked on August 22 at $19938, four days after our update was posted. Now, it is back at the crime scene, so to say: $19400s. Thus, we must ask, "Is the countertrend rally over?”
Figure 1. NDX daily chart with detailed EWP count and technical indicators
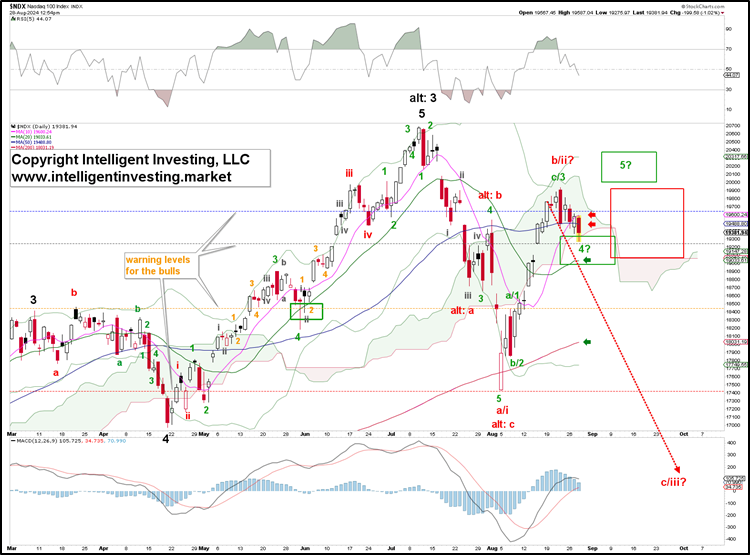
As the index moved higher the days after our last update, we raised the Bulls’ colored warning levels accordingly to help tell our premium members below which levels further upside would become less likely. The index has dropped below the blue first warning level and currently holds the grey second warning level. A daily close below will be a good sign that the next leg lower has started, with a break below the orange level at $19450, essentially the second-to-last nail in the Bulls’ coffin.
In our previous update, we also promised to share that we can count five larger waves from the critical October 2022 low into the July high, shown in Figure 2 below.
Figure 2. NDX daily chart with detailed EWP count and technical indicators
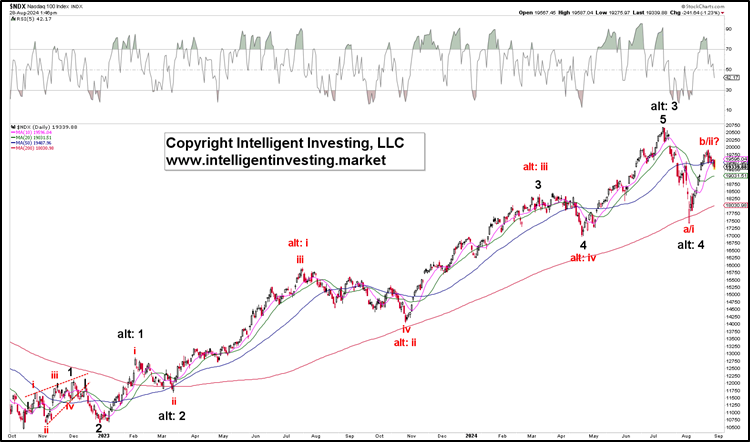
Namely, the rally from the October 2022 low to the November 2022 high, followed by the December low, counts best as a leading diagonal 1st wave and 2nd wave decline, respectively. From there, the next set of waves developed—a subdividing black W-3 (red W-v, ii, iii, iv, v), etc. However, given that the December 2022 decline retraced almost 90% of the previous choppy rally, which is relatively uncommon although technically still valid, for a 2nd wave, it could be that the count starts after that, labeled alt: 1, alt: I, etc. In that case, the current decline and rally are part of a more significant 4th wave.
Lastly, going back to Figure 1, the bears do not want to see the index break above last week’s high, as that would put five (green) waves on the chart instead of three. Namely, that would mean the August 5 low was the black “alt: 4” low, as shown in Figure 2. Thus, although our target zone outlined in early August for this (retracement) rally has been reached, and our preferred long-term view is that of a significant top being in place since July, the Bears still have more work to do before they can declare victory.
Author

Dr. Arnout Ter Schure
Intelligent Investing, LLC
After having worked for over ten years within the field of energy and the environment, Dr.


