Nasdaq100: Are new all-time highs around the corner?
For those new to our Elliott Wave-based analyses and as a reminder to our regular readers, we have been tracking an ending diagonal (ED) pattern for the NASDAQ100 (NDX) for several months, and in our previous update from December 27, 2024, we concluded
“… contingent on holding at least below yesterday’s high at $21837, and especially below the recent all-time high at $22133, we should expect the index to bottom around the $20300-600 level for the red W-iv before it can stage the next more significant, red W-v rally, to ideally $22825-23400.”
As the index stayed below $21837, it bottomed out two-and-a-half weeks later, on January 13, 2025, at $20538. The NDX has since staged a rally of> 900p. See Figure 1 below. Once again, our Premium Major Markets Members were on the right side of the trade.
Figure one. NDX daily chart with detailed Elliott Wave count and technical indicators
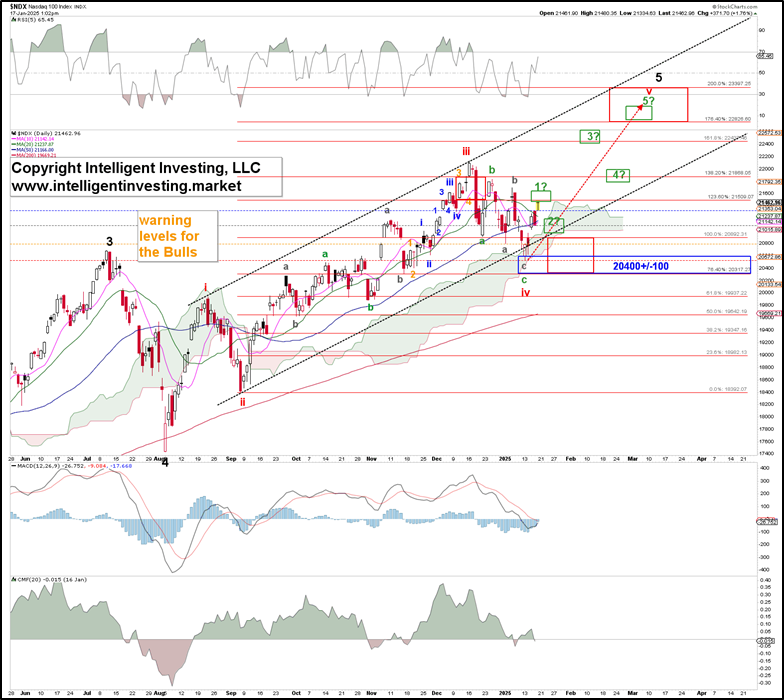
The anticipated red W-iii top came and went, and the red W-iv has most likely also been completed. Note that these levels align with what we already anticipated in late November, showing the forecasting power one can enjoy using the EW.
Thus, contingent on holding at least above $20800, the orange warning level for the Bulls, and especially above the January 13 low at $20538, we should expect the index to reach the red W-v’s ideal target zone at $22825-23400. The red arrow shows the standard W-v = W-i level at $23025. Meanwhile, we have penciled in a standard Fibonacci-based impulse pattern with the green W-1? through W-5? for this red W-v.
However, since we’re most likely dealing with an Ending Diagonal from the August 2024 low, which comprises a 3-3-3-3-3 pattern, we may see short-term deviations, i.e., an a-b-c advance from the January 13 low. Regardless, and since the short-term is always the most variable and, therefore, the least certain, we keep our eyes on the price: $22825-23400.
Author

Dr. Arnout Ter Schure
Intelligent Investing, LLC
After having worked for over ten years within the field of energy and the environment, Dr.


