NASDAQ Elliott Wave technical analysis [Video]
![NASDAQ Elliott Wave technical analysis [Video]](https://editorial.fxsstatic.com/images/i/Equity-Index_Nasdaq-2_XtraLarge.jpg)
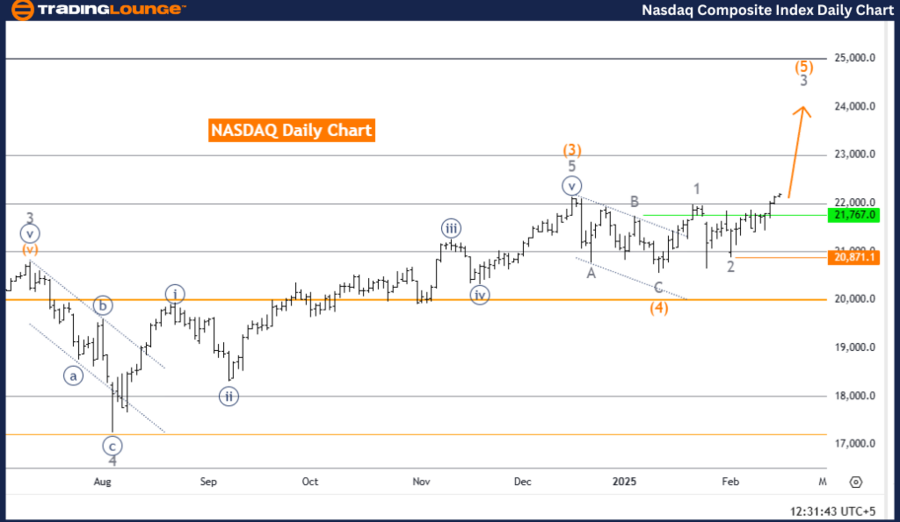
NASDAQ Elliott Wave Analysis – Trading Lounge Day Chart.
NASDAQ Elliott Wave technical analysis
-
Function: Bullish Trend.
-
Mode: Impulsive.
-
Structure: Gray Wave 3.
-
Position: Orange Wave 5.
-
Direction next higher degrees: Gray Wave 3 (Started).
-
Wave cancel invalid level: 20,871.1.
Market overview
The NASDAQ daily chart analysis confirms a bullish trend, with the market mode classified as impulsive, indicating strong upward momentum. The current wave structure places the market in Gray Wave 3, forming part of the broader Orange Wave 5. This suggests that the market is in a major upward movement phase, with Gray Wave 3 pushing prices higher.
The analysis also highlights that Gray Wave 2, which served as a corrective phase, appears to be completed. This marks the beginning of Gray Wave 3, expected to drive the price further upward. With Gray Wave 3 now active, the bullish momentum is likely to persist in the near term.
Key level to monitor
A critical price level to watch is the wave cancellation invalid level at 20,871.1. This level acts as a key threshold—if the price drops below this point, the current wave count would be invalidated, potentially shifting the bullish outlook. Traders should closely monitor this level to confirm the validity of the ongoing bullish trend.
Conclusion
The NASDAQ daily chart analysis indicates a strong bullish trend, currently in Gray Wave 3 of Orange Wave 5. The completion of Gray Wave 2 has paved the way for further upward movement, reinforcing the bullish sentiment in the market.
The wave invalidation level at 20,871.1 serves as a crucial marker for confirming the continuation or potential reversal of the bullish trend. The next higher degree wave, Gray Wave 3, is anticipated to drive prices higher, providing a clear framework for understanding market dynamics and potential future movements.
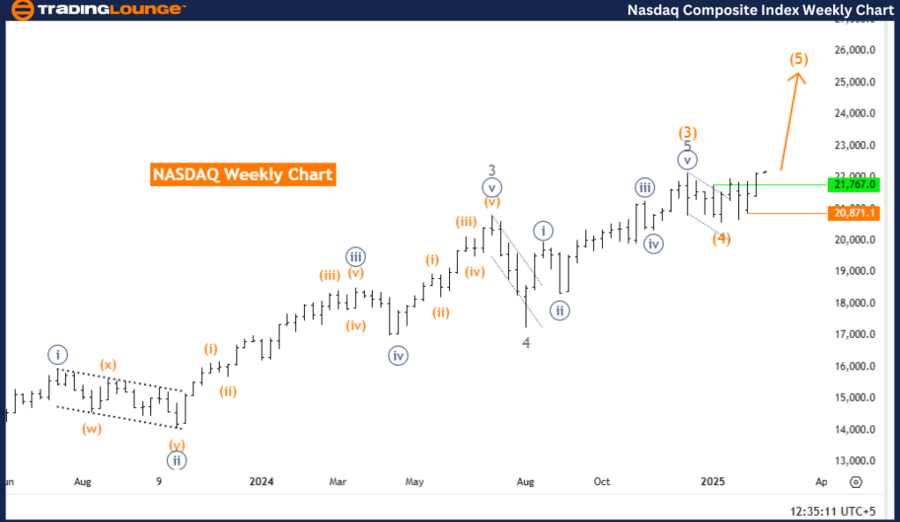
NASDAQ Elliott Wave Analysis – Trading Lounge Weekly Chart.
NASDAQ Elliott Wave technical analysis
-
Function: Bullish Trend.
-
Mode: Impulsive.
-
Structure: Orange Wave 5.
-
Direction next higher degrees: Gray Wave 3 (Started).
-
Wave cancel invalid level: 20,871.1.
Market overview
The NASDAQ weekly chart analysis confirms a bullish trend with an impulsive wave structure. The market is currently in Orange Wave 5, signaling continued upward momentum. This reflects a strong growth phase, with further gains anticipated.
The previous Orange Wave 4 appears to have completed, and the market has now transitioned into Orange Wave 5. This confirms that the bullish trend remains intact, with the potential for further price increases.
Next wave projection
The next higher-degree wave in focus is Gray Wave 3, which has already started. This suggests that the market is in a larger uptrend, reinforcing the potential for continued bullish movement.
Conclusion
The NASDAQ weekly chart presents a strong bullish outlook, with Orange Wave 5 actively unfolding. The completion of Orange Wave 4 indicates that the market has entered a new upward phase.
As long as the wave structure remains valid, further gains are expected. However, the wave cancel invalid level is set at 20,871.1, meaning that a drop below this level would invalidate the current wave count.
Technical analyst: Malik Awais.
NASDAQ Elliott Wave technical analysis [Video]
Author

Peter Mathers
TradingLounge
Peter Mathers started actively trading in 1982. He began his career at Hoei and Shoin, a Japanese futures trading company.


