NASDAQ 100 slumps for third straight day: GOOGL, BTC, QQQ, EL, NDX
- US job openings and layoffs strike fear in equity market.
- NASDAQ 100 drops to more than two-month low.
- Bitcoin falls below $67,000 to reach 15-month low.
- GOOGL sinks 4% despite major beat on Q4 results.
- Software is facing demonstrable weakness from threat of AI.

It's not looking good out there for markets this week. Poor US jobs numbers contributed to a spreading fear that the US labor market is faltering. US JOLTS Job Openings data for December fell from 6.9 million in November to 6.5 million.
Challenger, Gray & Christmas issued a report that US corporations had laid off 108K employees in January, the worst showing for the month since 2009.
The NASDAQ 100, which heavily favors tech stocks, slumped to its lowest level since November 24. Despite an impressive showing from Alphabet's (GOOGL) Q4 results late Wednesday, shares of the search giant are trading down over 4% on Thursday morning. The Estée Lauder Companies (EL) crashed over 21% on earnings results and soft guidance that pointed to $100 million in higher tariff costs. Super Micro Computer (SMCI) sold off 10% on its own results, while Eli Lilly (LLY) dropped 7%.
The heavy risk-off perception has pushed Bitcoin (BTC) down as much as 8% to 15-month lows below $67,000. Bitcoin has now lost over $1 trillion in market cap in the past three weeks, and concern is mounting about the risk to Michael Saylor's Strategy (MSTR), which is at least $6 billion under water on its Bitcoin holdings. Shares of MSTR are now down some 72% off their all-time high.
Move to safety affects most assets
Unlike many risk-off scenarios, Gold is not benefiting from the run to safety. The shiny metal fell 3% to near $4,800 per troy ounce.
Meanwhile, US Treasuries are benefitting greatly. US Treasury yields dropped across the curve, particularly the 5-year (1.8%) and the 10-year (-1.45%). The 2-year/10-year spread expanded to its largest level in about four years, and the yield curve is notably steepening.
West Texas Intermediate Oil dropped over 3% to $63.16.
Consumer Discretionary, Basic Materials and Energy were the worst-performing sectors, while Healthcare, Consumer Staples and Utilities are performing best.
NASDAQ 100 weakens into what might become extended slump
Nearly one-third of NASDAQ 100 holdings are now listed as oversold based on the Relative Strength Index (RSI). The ten most oversold constituents are:
- PayPal Holdings (PYPL)
- Thomson Reuters (TRI)
- Take-Two Interactive Software (TTWO)
- Axon Enterprise (AXON)
- Verisk Analytics (VRSK)
- Constellation Energy (CEG)
- Shopify (SHOP)
- Intuit (INTU)
- Qualcomm (QCOM)
- Intuitive Surgical (ISRG)
The Invesco QQQ Trust (QQQ), the most popular ETF for trading the NASDAQ 100, fell below $600 for the first time since mid-December, erasing much of the gains surrounding New Year's.
Over the past five trading sessions, Advanced Micro Devices (AMD) has lost over 19%, while Palantir Technologies (PLTR) has dropped 11.5%.
Much of the negativity surrounds the software space, where Microsoft (MSFT) led the way with its post-earnings capitulation last week. MSFT shares are now down 27% off their all-time high back in July 2025. The general feeling is that artificial intelligence (AI) is coming to attack the space's high gross margins as new platforms like Base44 and Claude make it easier to either build one's own app, in the former's case, or use special AI features to automate professional work. Anthropic's Claude platform introduced a new plug-in this week that directly augments document review and compliance tracking for law firms.
In a client note this week, Wedbush's Dan Ives said, "Is AI a headwind in the near-term for software? YES!...however, the magnitude of this software sell-off is a major head scratcher and is factoring in an Armageddon scenario for the sector that is far from reality in our view."
NASDAQ 100 technical analysis
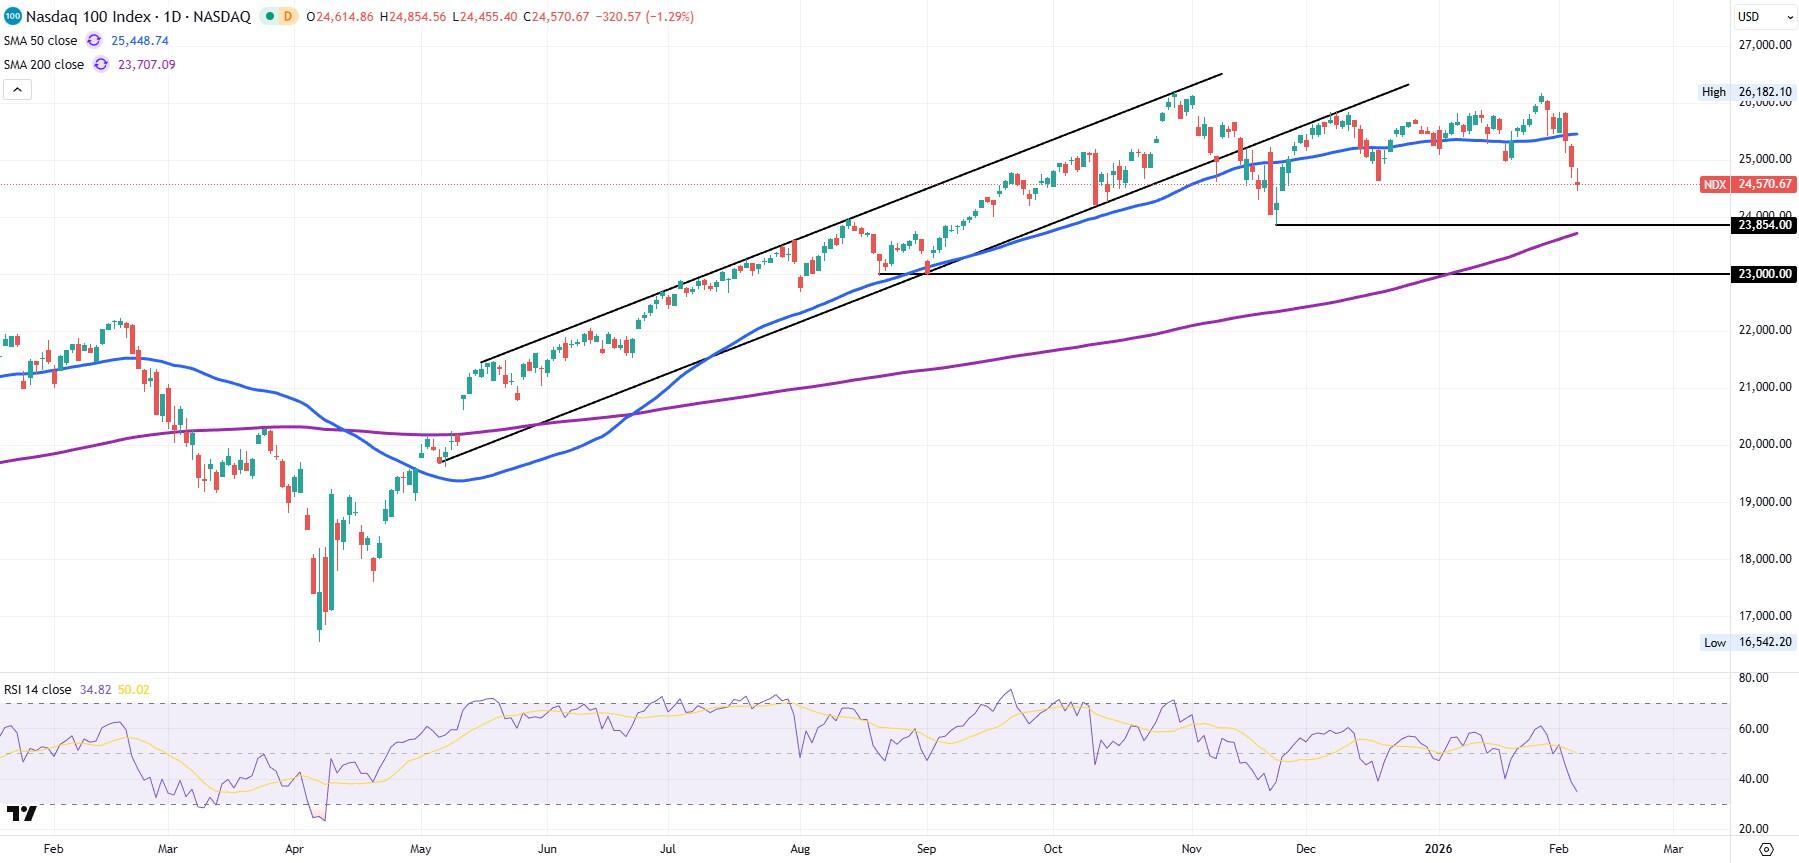
A full-blown pullback was in the cards for the NASDAQ 100 since the index fell out of its tight ascending price channel back in November 2025. However, Thursday's rout has pushed the index to a new range low after breaking below the December 17 low of 24,647.
Trading well below the 50-day Simple Moving Average (SMA) seen in blue, the next realm of support lies just below the 24,000 handle. The 23,854 low from November 21, 2025, provides promise as it coincides with the rising 200-day SMA. But if not, the 23,000 support handle from last autumn also looms large.
This will remain a bear market until the NDX retakes the 50-day SMA, currently at 25,450.
Author

Clay Webster
FXStreet
Clay Webster grew up in the US outside Buffalo, New York and Lancaster, Pennsylvania. He began investing after college following the 2008 financial crisis.

















