NASDAQ 100 rally to new all-time highs underway
Our last two updates for the NASDAQ100 (NDX) stressed that “any Bear market/correction is a Major Buying Opportunity (BIMBO) for those looking beyond today and tomorrow. This time, it will be no different.” Case in point, in our update from April 8, we concluded,
“we focus on the index wrapping up these smaller 4th and 5th waves, which will be followed by a rally of at least 15-25%.”
Fast-forward, and the index has been up over 22% since then. Besides, in our previous update, we found that the NDX would reach at least around $21400. Currently, it is trading at $21300. Meanwhile, only 11 to 29% of individual investors per the AAII sentiment survey have been bullish since April 16, as only 11% use (paid for) newsletters and research services to assess the stock market. Thus, analyzing the stock market’s price charts objectively using the Elliott Wave (EW) Principle helped us explain its condition and prevented bias and subjectivity, which otherwise would lead to irrational decisions, e.g., selling instead of buying. Thus, the Elliott Wave, high-quality newsletters, and research services are indispensable tools for assessing the stock market correctly.
Now that three more weeks of price data are available, we have more details for forecasting the index’s most likely path. Allow us to explain below.
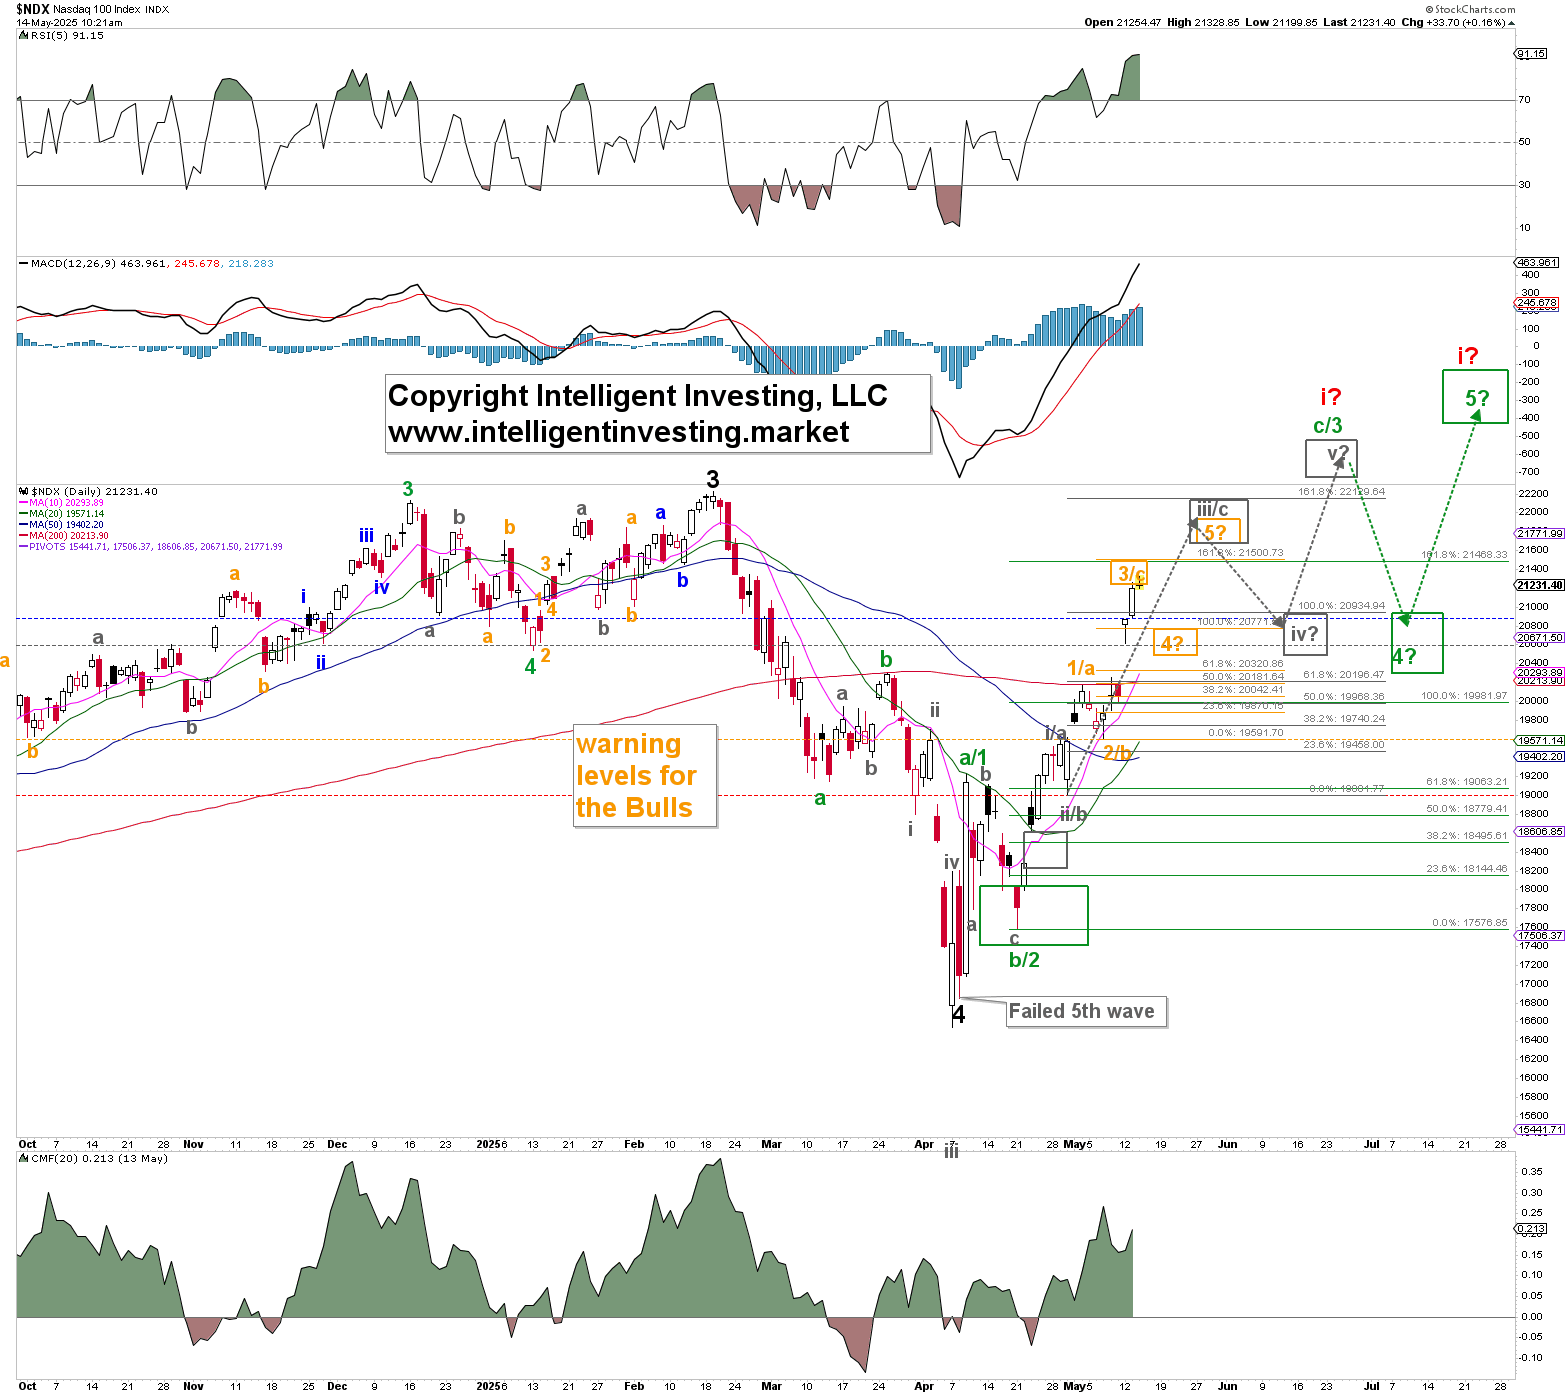
Figure 1. NDX daily chart with detailed Elliott Wave count and technical indicators
The index should now be in the orange W-3/c, and although we still cannot know at this stage if we will get five waves up (1-5) or only three (a-b-c) on the various degrees (orange, grey, green), we prefer the five-wave sequence due to several external factors like recent breadth thrusts. However, we must continue to label the current advance as 1/a, 2/b, 3/c, 4?, 5? until one or the other has been proven. Thus, we expect the orange W-3/c to complete at around $21400, then a pullback for the orange W-4 to ideally $20800+/-100, followed by the orange W-5 to $22000+/-200 etc., contingent on the index’s price holding at least above $20000 (grey warning level) and especially $19600 (orange warning level).
Namely, due to the recent rallies since April 8, which overlapped with the early March (red W-a) low, we know that the decline from the February high into the April low was only three waves: red W-a, -b, and -c, and thus corrective. See Figure 2 below.
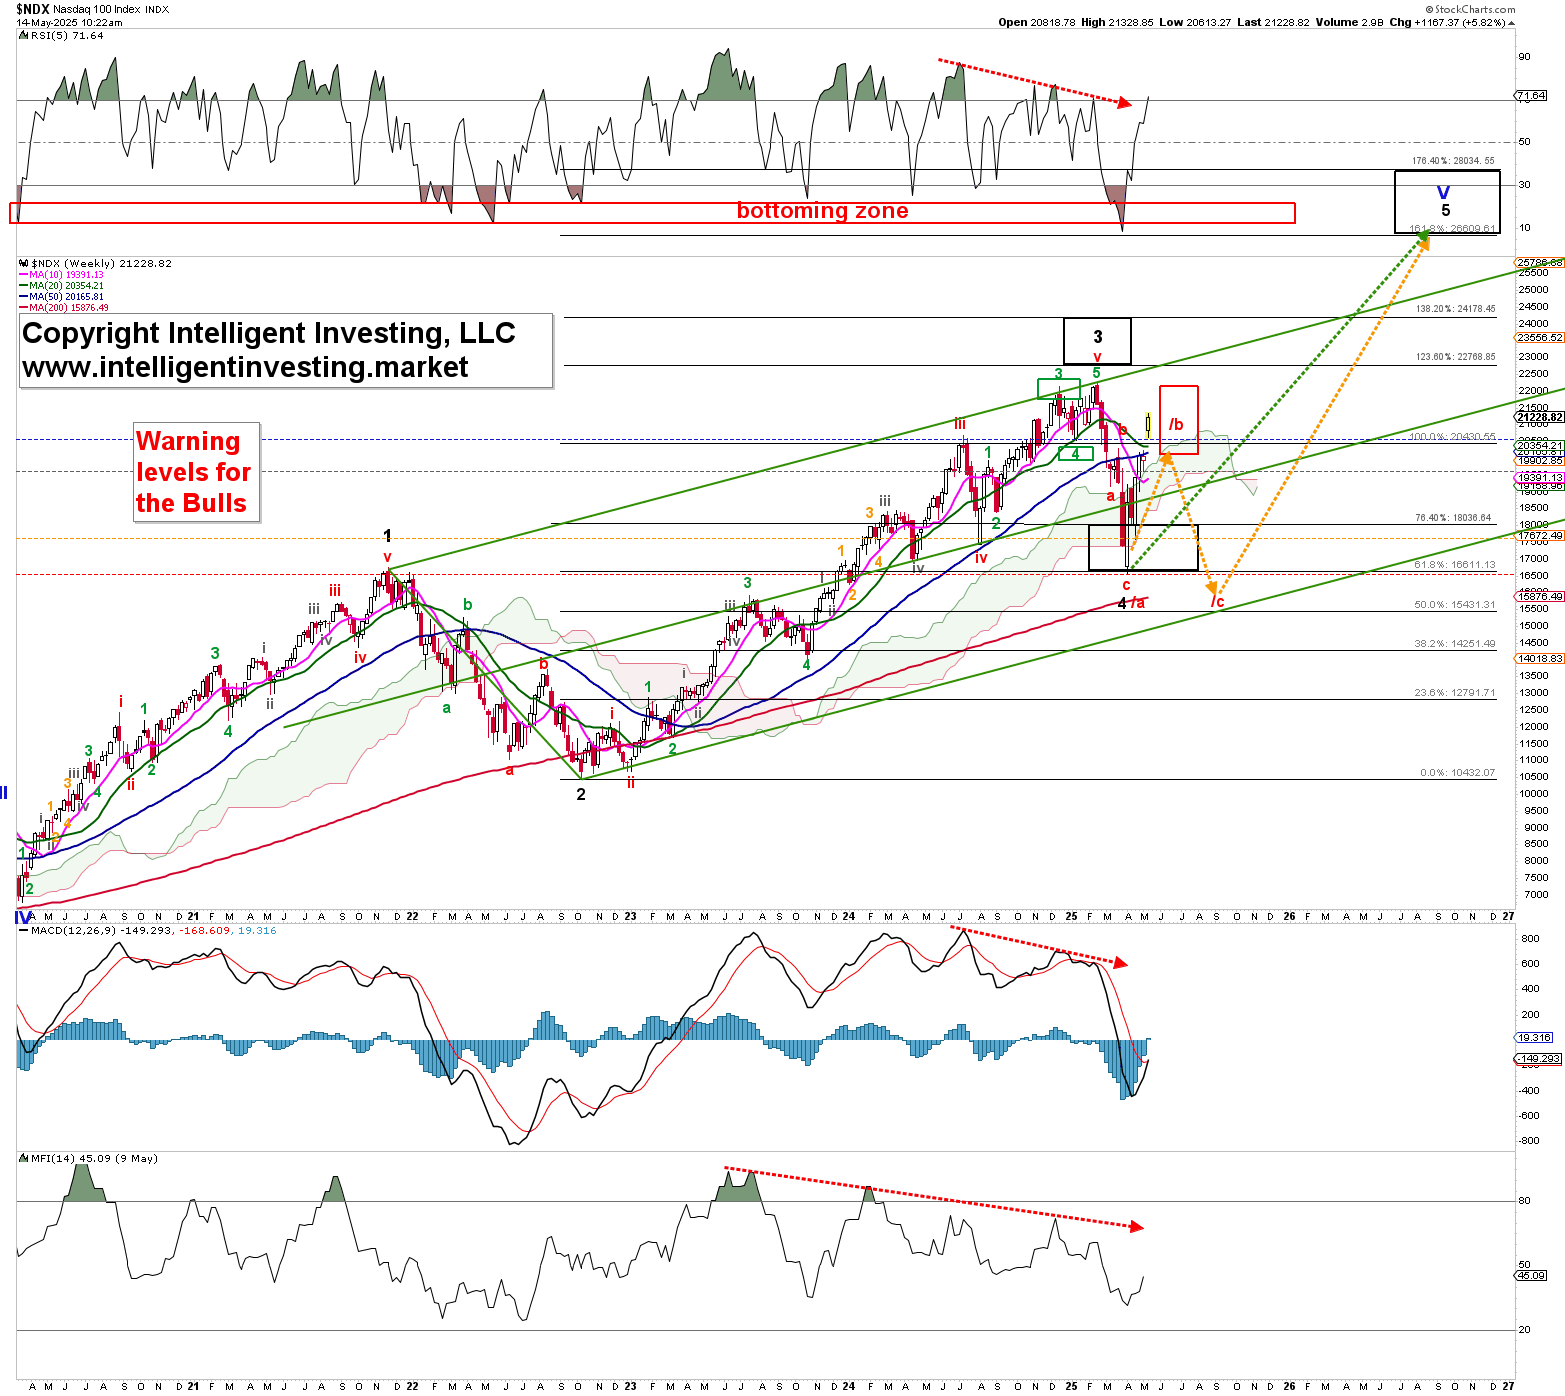
Figure 2. NDX weekly chart with detailed Elliott Wave count and technical indicators
This means the index will rally to new all-time highs. But we don’t know yet exactly how, either directly per the green five-wave sequence shown in Figure 1 (green dotted arrow in Figure 2) or via a detour, where the NDX stalls at around $21500-22500, falls back to ~$15400, and then rallies to new ATHs (orange dotted arrow). Please note that this is not our preferred option; it is our alternative. We always trade and invest using the preferred path: Figure 1. The alternative is our insurance IF the market takes this low-odds path. Besides, it takes a break below $19000 from current levels with a severe warning below $19600 to tell us that’s what the market wants. Thus, we will have ample forewarning.
Author

Dr. Arnout Ter Schure
Intelligent Investing, LLC
After having worked for over ten years within the field of energy and the environment, Dr.


