|

Nasdaq 100 rally stalling as Elliott Wave points to 23,270-830

In our previous update about the NASDAQ 100 (NDX), when the index was trading around 24520, we found that, according to the Elliott Wave (EW) Principle, the index is in an impulse (five-wave) move up from the early April lows, targeting 24770-25570 for an interim top.

Fast forward two weeks, and the index reached 24958 today. It is perfectly within the ideal target zone and reversed intra-day. Therefore, the odds are increasing that the intermediate (green) W-3 top has been hit. See Figure 1 below.

Figure 1. Our preferred short-term Elliott Wave count for the NDX
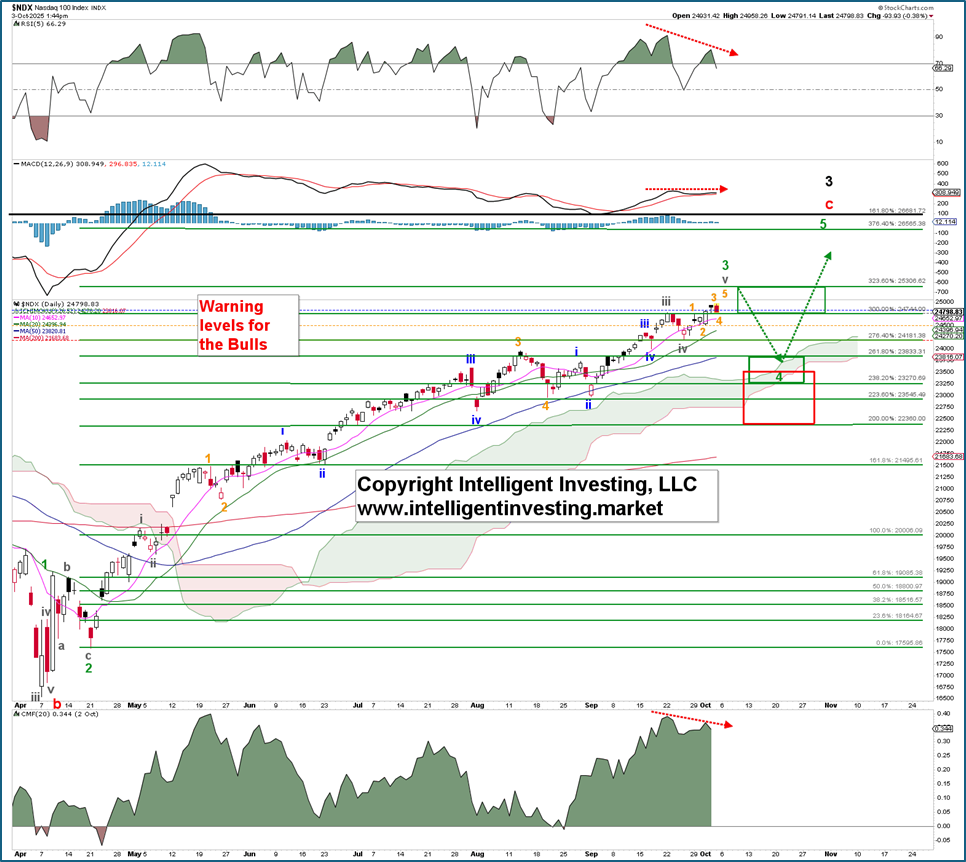
We can allow one smaller (orange) W-5 to reach as high as ~25300, but it is no longer necessary, and that would be like picking up pennies in front of a steam train. Thus, the index has, as expected, entered the zone where the likelihood of a pullback, the green W-4, is high. Additionally, there’s plenty of negative divergence (red dotted arrows) on the technical indicators. However, since these are conditions, not trade triggers, the price will now need to break below the orange warning level* at 24505 to confirm this thesis.

Regardless, the green W-4 is inevitable and should ideally retrace 23.6-38.2% of the green W-3, the red target zone between 22360 and 23500. However, since in bull markets “the downside disappoints and the upside surprises,” while the 4th and 2nd waves are often equal in length, a drop to the orange target zone at 23270-23830 is more likely. From there, we can expect one last fifth wave, the green W-5, to target a point close to the ideal black 161.80% Fibonacci extension, approximately 26680, which is also the green 376.4% extension—a typical extended fifth-wave target—at 26565. Once reached, a bear market like 2022 will follow for the black W-4. See Figure 2 below.

Figure 2. Our preferred long-term Elliott Wave count for the NDX
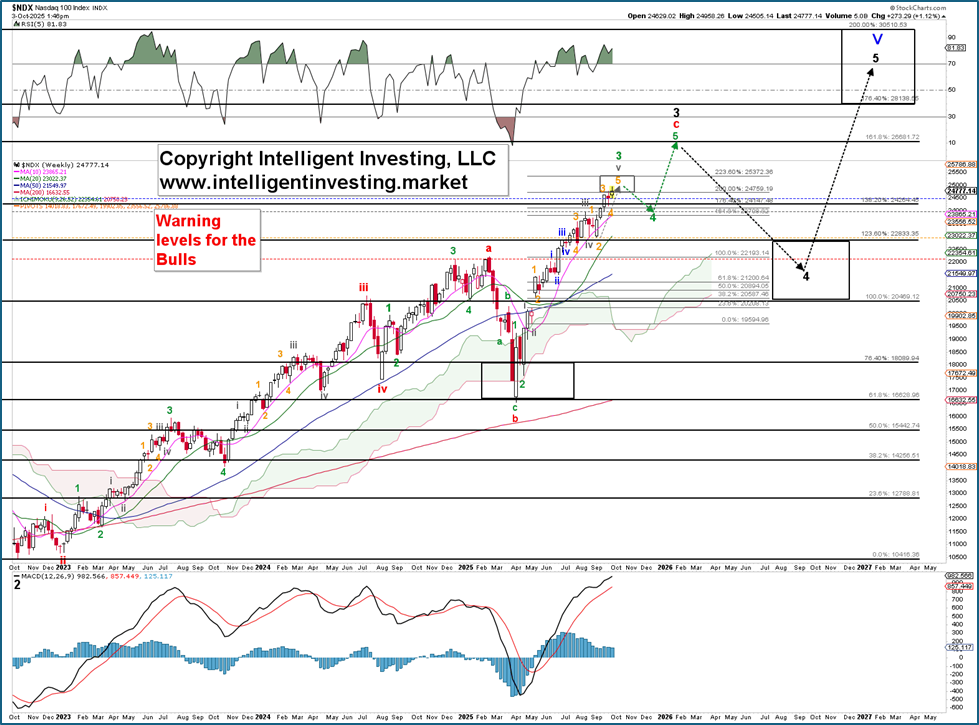
*These levels, which serve as our safety nets, as drops below these levels increase the chance (25%, 50%, 75%, 100%, respectively) that the top is in are raised as the index rises: 1st, blue: 24816; 2nd, gray: 24741; 3rd, orange: 24505; 4th, red: 24186.

Author

Dr. Arnout Ter Schure

Dr. Arnout Ter Schure

Intelligent Investing, LLC

After having worked for over ten years within the field of energy and the environment, Dr.

More from Dr. Arnout Ter Schure
Share:

Editor's Picks

GBP/USD keeps the bid bias near 1.3550

GBP/USD leaves behind part of the recent three-day retracement and hovers around the 1.3550 region on Monday. The Greenback’s fresh downward trend helps Cable and the rest of the risk complex recoup part of the recent ground lost while attention remains on the potential Fed rate path.

EUR/USD retakes 1.1600; looks at the 200-day SMA

EUR/USD manages to gather fresh steam and advances past the 1.1600 hurdle as Monday’s NA session draws to a close. Indeed, the pair patially reverses Friday’s sharp retracement amid the renewed downside momentum in the US Dollar. Moving forward, the flash Inflation Rate in the euro zone and US JOLTs and the ISM Manufacturing should keep investors entertained on turnaround Tuesday.

Gold: Is the bullish run over?

Gold adds to Friday’s marked decline, although it has managed to bounce off earlier lows in the sub-$4,400 region per troy ounce on Monday. The yellow metal’s pullback comes despite the softer stance in the US Dollar and steady uncertainty in the Middle East, although rising yields keep bulls at bay for now.

Bitcoin and Gold Outlook: BTC clings to support, XAU slides as US-Iran tensions re-escalate
Bitcoin (BTC) maintains stability above $78,000 support on Monday as crypto prices broadly consolidate. Gold (XAU/USD), meanwhile, holds above $4,400, marking two consecutive days of declines. Sentiment in the broader cryptocurrency market remains broadly positive, with the Fear & Greed Index holding at 62 on Monday, down slightly from 69 the previous day.
Oil rallies on fresh persian gulf strikes
Energy prices are trading firmer this morning after the US carried out targeted strikes against Iran, drawing retaliatory strikes and reinforcing concerns about a prolonged stalemate in the Persian Gulf. Oil prices started the week stronger following the first military strikes between the US and Iran in a month. ICE Brent briefly moved back above US$90/bbl in early morning Asia trading.
Diesel’s record $100 warning: The oil shock hiding in plain sight

The Oil market may look calmer than it did a few months ago, but diesel is sending a very different message. The US diesel crack spread, the premium of ultra-low sulphur diesel futures over WTI, recently surged above $100 per barrel for the first time, reaching an intraday record of just over $102.00.















