MU Elliott Wave technical analysis [Video]
![MU Elliott Wave technical analysis [Video]](https://editorial.fxsstatic.com/images/i/supermicro-01_XtraLarge.jpg)
MU Elliott Wave analysis
Function: Trend.
Mode: Motive.
Structure: Impulsive.
Position: Wave (v) of {v}.
Direction: Uptrend.
Details: Price expected to move toward wave (v) once wave iv finishes.
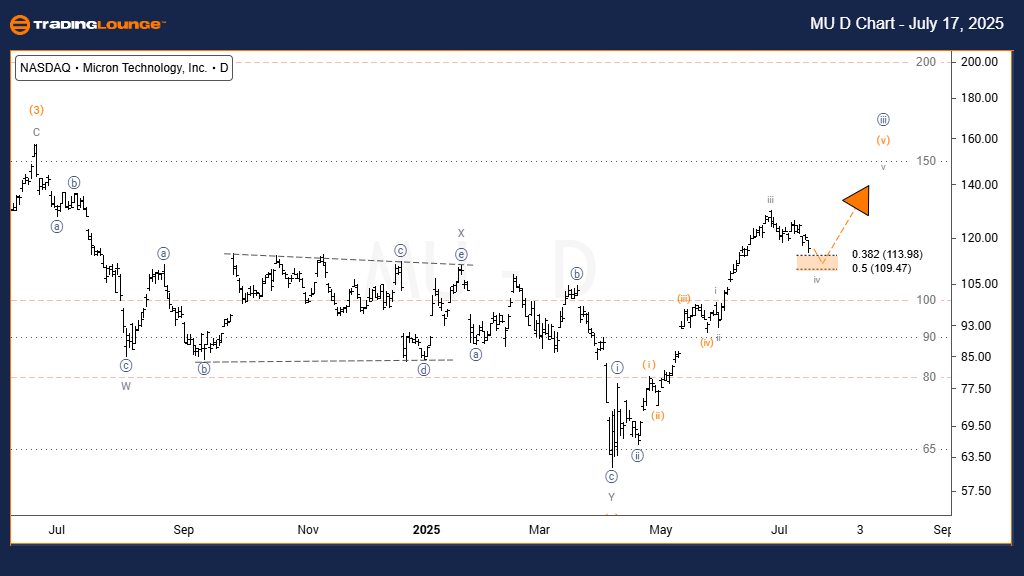
On the daily chart, Micron Technology Inc (MU) continues to move within a clear impulsive structure. The stock has completed wave iii of (v) and is currently retracing through wave iv. This correction is projected to reach the 38.2%–50% Fibonacci retracement zone of wave iii.
Once wave iv concludes, the analysis anticipates a strong rally in wave v of (v), marking the end of the broader wave (v) of {iii} cycle. Traders should monitor the retracement levels closely for potential bullish setups as the stock prepares for the final upward leg of this impulse.
MU Elliott Wave analysis
Function: Trend.
Mode: Motive.
Structure: Impulsive.
Position: Wave (5) of {5}.
Direction: Uptrend.
Details: Price is in wave (5) of {5}, targeting the upper boundary of the parallel channel.
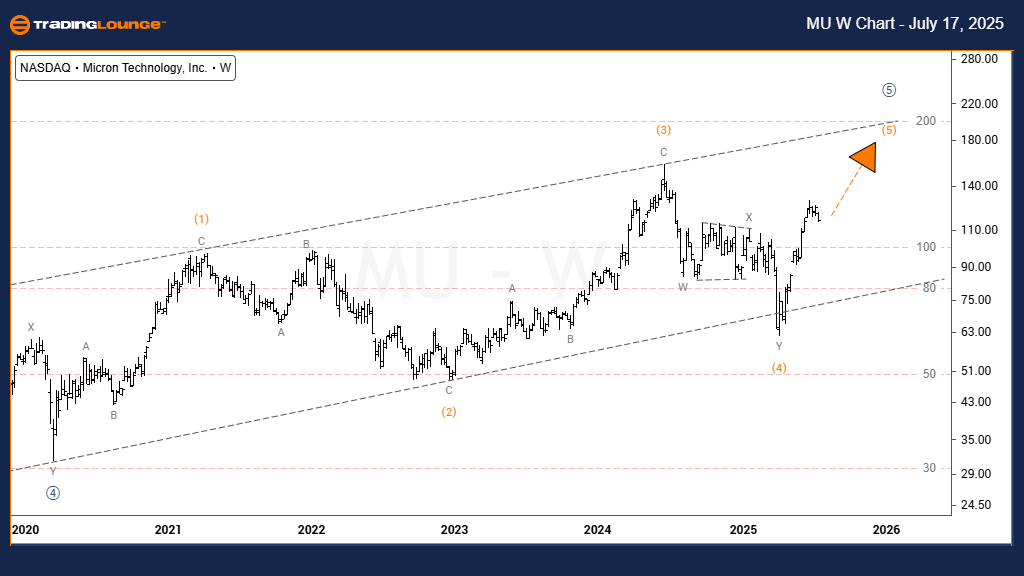
On the weekly chart, Micron Technology Inc (MU) is moving inside a strong uptrend and confined within a well-defined parallel channel. After completing wave {4} as a double zigzag correction, the stock entered wave {5}, which is unfolding as an impulsive sequence.
Wave (5) is currently developing and expected to rise toward the channel's upper resistance, a probable target for the final move. Any interim pullbacks are likely to present favorable entry opportunities before the wave structure reaches exhaustion. The chart supports continued bullish action as long as the wave progression holds.
MU Elliott Wave analysis [Video]
Author

Peter Mathers
TradingLounge
Peter Mathers started actively trading in 1982. He began his career at Hoei and Shoin, a Japanese futures trading company.


