More uncertainty for stocks: Is there further upside?
Stocks didn’t move much on Friday, with the S&P 500 closing 0.19% lower after reaching a new all-time high of 5,733.57 on Thursday. So, was Friday’s session just a pause before another leg higher, or is it signaling a potential topping pattern ahead of a downward correction? Today, the market is likely to open 0.1% higher, as indicated by futures contracts, and the index is expected to continue its short-term fluctuations.
The question remains: Will the uptrend continue, or is this just part of a volatile consolidation, potentially forming a topping pattern before a downward reversal? I still think that the market is forming a high, and the seasonal pattern will play out in such a way that indexes will set their highs in September, with the low of the correction occurring in October.
Investor sentiment improved last week, as shown by the Wednesday’s AAII Investor Sentiment Survey, which reported that 50.8% of individual investors are bullish, while only 26.4% of them are bearish, down from 31.0% last week.
The S&P 500 index is trading around the 5,700 level, as we can see on the daily chart.
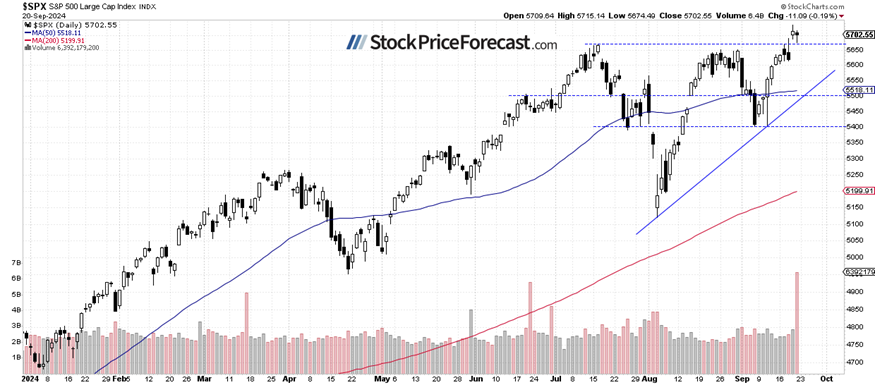
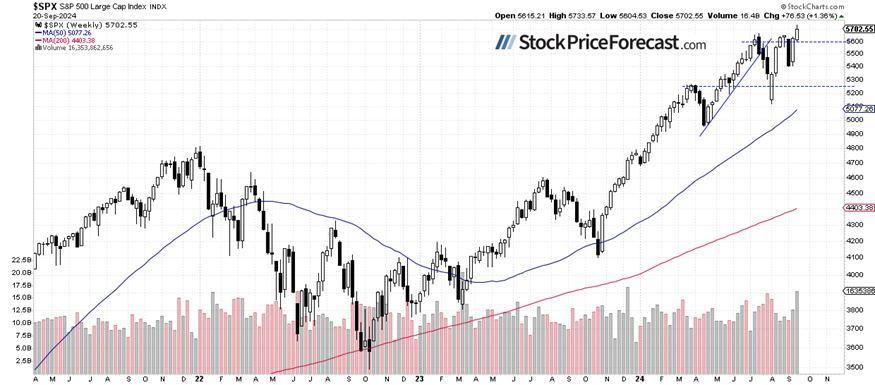
S&P 500 gained 1.4% last week
Compared to the previous Friday’s close, the S&P 500 gained 1.36%, extending its previous week’s rally of 4%. The market broke above its highs from July and August. However, the end of last week’s trading suggests a short-term high may have been reached. Key support is located at the previous highs around the 5,650 level.
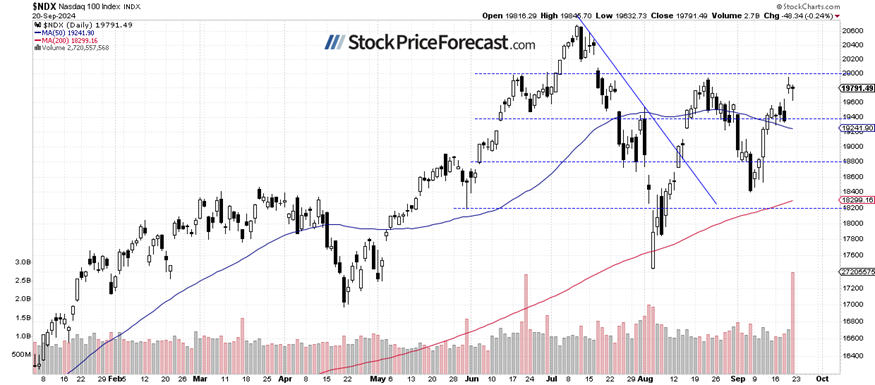
Nasdaq 100 remained below 20,000
The technology Nasdaq 100 index lost 0.24% on Friday, after gaining 2.6% on Thursday. However, it remains relatively weaker than the broader stock market, trading near its local high from August 22 and significantly below the July 10 record high of 20,690.97. This morning, the Nasdaq 100 is expected to open 0.2% higher.
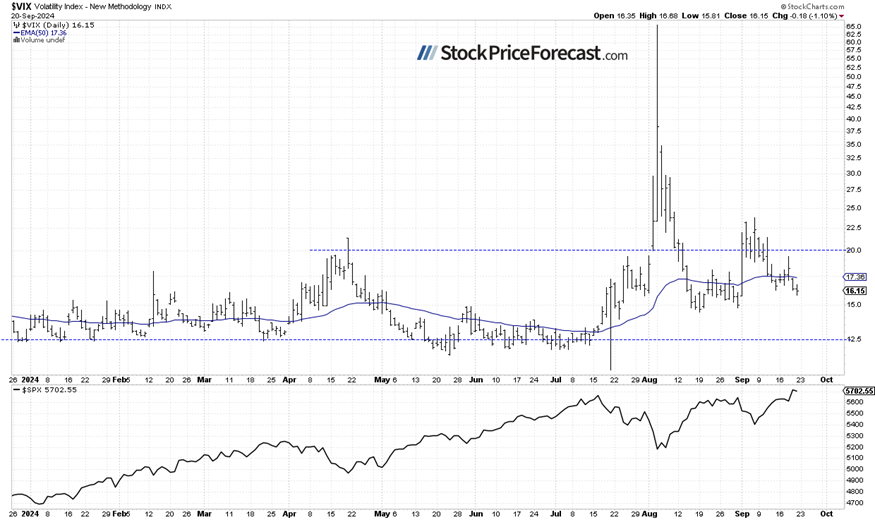
VIX: Remaining close to 16
On September 6, the VIX index, a measure of market fear, reached a local high of 23.76. It was indicating elevated fear among investors. However, a stock rebound last week pushed the VIX lower. On Thursday and Friday, it was fluctuating along the 16 level again.
Historically, a dropping VIX indicates less fear in the market, and rising VIX accompanies stock market downturns. However, the lower the VIX, the higher the probability of the market’s downward reversal. Conversely, the higher the VIX, the higher the probability of the market’s upward reversal.
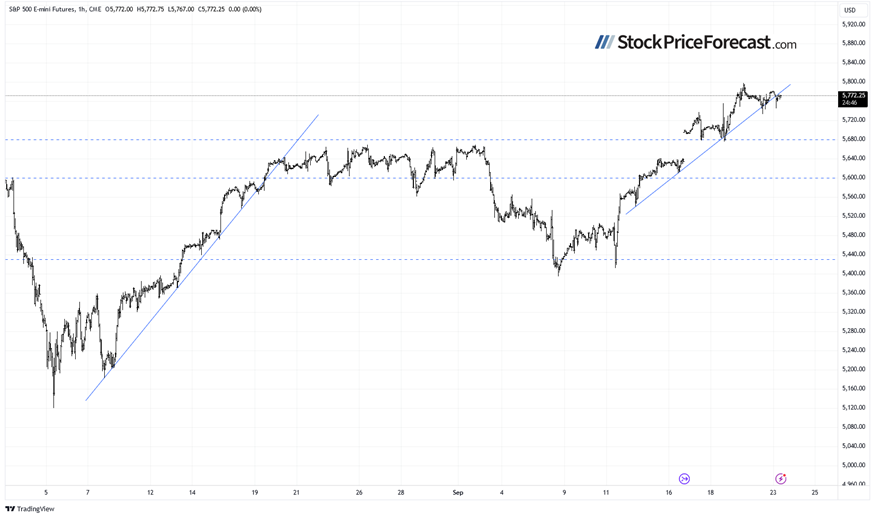
Futures contract: Topping pattern or just pause?
Let’s take a look at the hourly chart of the S&P 500 futures contract. This morning, it’s trading sideways again, fluctuating after Thursday’s rally. The resistance level is around 5,800, while support lies in the 5,730–5,750 range.
Conclusion
The S&P 500 reached a new record high on Thursday, but the question remains: Is there more upside ahead for stocks? This morning, the market is expected to open slightly higher, extending Friday’s consolidation.
Last Wednesday, I noted “A "buy the rumor, sell the news" scenario seems likely, but a bullish breakout to new highs can't be ruled out either.” Thursday’s rally invalidated a quick reversal scenario. While the overall market outlook remains bullish, this could also be the formation of a topping pattern before a more significant downward correction.
I opened a speculative short position in the S&P 500 futures contract last Monday.
In my Stock Price Forecast for September 2024, I noted that, “the market experienced significant volatility in August, with a roller-coaster ride that included a sell-off to the August 5 local low and a subsequent advance, leading to a consolidation near the record high. (…) sharp reversal suggests more volatility in September. Last month, I wrote that ‘August is beginning on a very bearish note, but the market may find a local bottom at some point.’ The same could be said today, and September will likely not be entirely bearish for stocks.”
For now, my short-term outlook remains bearish.
Here’s the breakdown:
-
The S&P 500 is fluctuating following its post-Fed rally.
-
The market may still be forming a topping pattern before a downward correction.
-
In my opinion, the short-term outlook is bearish.
Want free follow-ups to the above article and details not available to 99%+ investors? Sign up to our free newsletter today!
Want free follow-ups to the above article and details not available to 99%+ investors? Sign up to our free newsletter today!
Author

Paul Rejczak
Sunshine Profits
Paul Rejczak is a stock market strategist who has been known for the quality of his technical and fundamental analysis since the late nineties.


