M&M Indian stocks Elliott Wave technical analysis [Video]
![M&M Indian stocks Elliott Wave technical analysis [Video]](https://editorial.fxsstatic.com/images/i/Economic-Indicator_Recession-5.png)
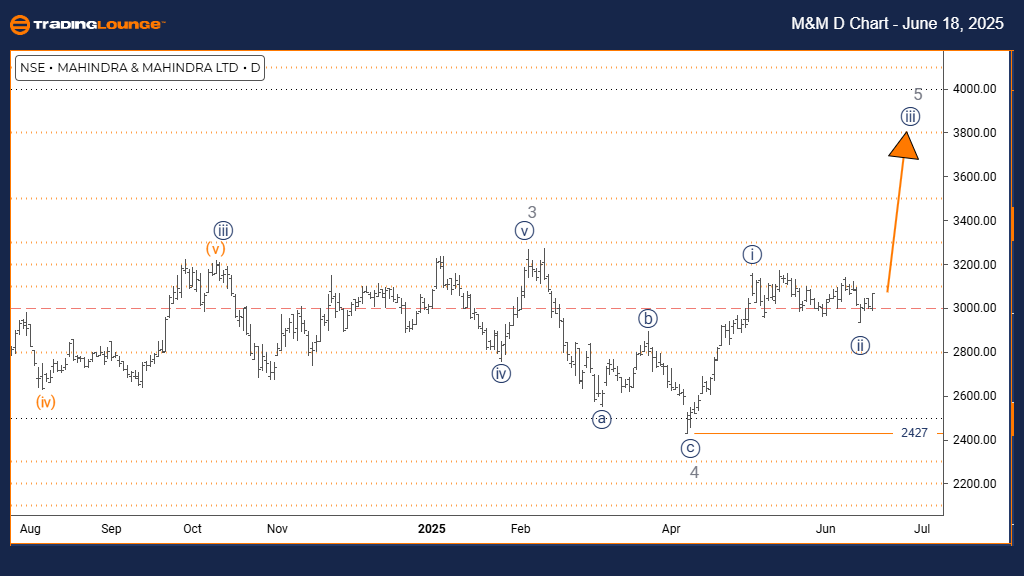
M&M Elliott Wave technical analysis
Function: Bullish Trend.
Mode: Impulsive.
Structure: Navy Blue Wave 3.
Position: Gray Wave 5.
Next higher degrees: Navy Blue Wave 3 (Initiated).
Details: Navy Blue Wave 2 looks completed; now Navy Blue Wave 3 of Gray Wave 5 is in progress.
Wave cancel invalid level: 2427.
The MAHINDRA & MAHINDRA daily chart analysis using Elliott Wave shows a bullish setup. The price is in an impulsive phase, indicating a strong uptrend. The wave structure now points to Navy Blue Wave 3, which belongs to a larger Gray Wave 5 sequence. This suggests that the stock is advancing firmly in the final phase of its bullish pattern.
Navy Blue Wave 2 appears to have completed its correction, signaling the beginning of Navy Blue Wave 3 within Gray Wave 5. Typically, this third wave is the strongest in Elliott Wave theory and may lead to notable price gains. Investors should watch Navy Blue Wave 3 as it evolves in the overall Gray Wave 5 framework.
A key price level to monitor is 2427. If the stock falls below this, the current wave interpretation will no longer be valid, and the bullish outlook will need to be reassessed. As long as the price stays above this level, the existing wave pattern suggests that the upward trend will likely continue.
The current chart setup indicates that MAHINDRA & MAHINDRA may experience continued upward momentum, as Navy Blue Wave 3 gains strength after completing Navy Blue Wave 2. The impulsive wave structure points to strong buying activity. However, since this third wave is part of a fifth wave, caution is advised—this could be the last phase of the current bullish trend.
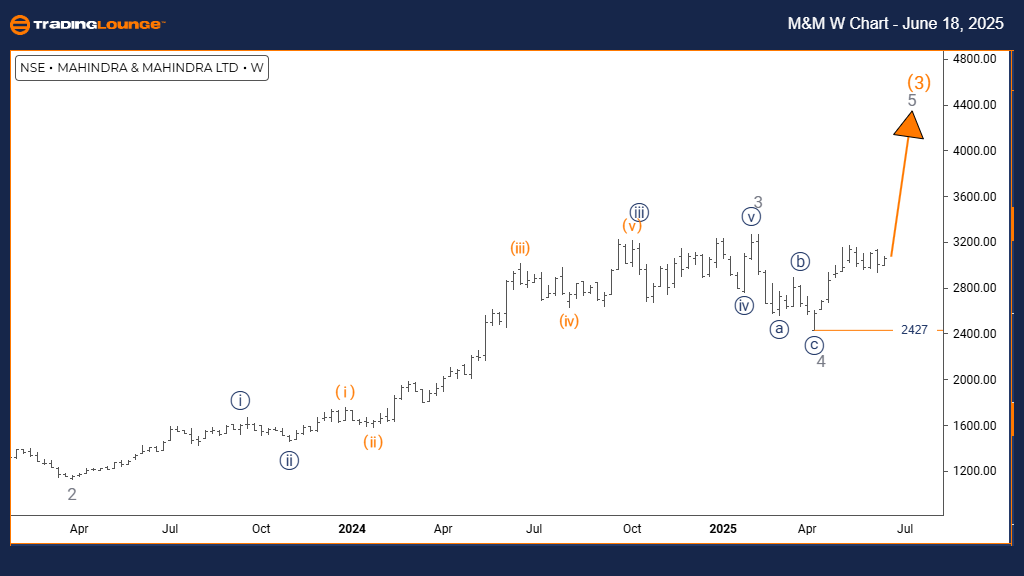
M&M Elliott Wave technical analysis
Function: Bullish Trend.
Mode: Impulsive.
Structure: Gray Wave 5.
Position: Orange Wave 3.
Direction next higher degrees: Gray Wave 5 (Initiated).
Details: Gray Wave 4 seems completed; Gray Wave 5 is now active.
Wave cancel invalid level: 2427.
The MAHINDRA & MAHINDRA weekly chart analysis based on Elliott Wave theory confirms a bullish trend. The price is currently moving in an impulsive phase, suggesting strong upward pressure. The wave formation indicates Gray Wave 5, which is a part of the broader Orange Wave 3 sequence. This setup reflects the final advancing stage of the current bullish cycle.
Gray Wave 4 appears to have completed its corrective pattern, marking the start of Gray Wave 5. This fifth wave usually displays strong momentum and could lead to significant price gains before a potential market correction. Traders should focus on the development of Gray Wave 5 within the larger Orange Wave 3 structure.
An important technical level to watch is 2427. If the price drops below this point, the current Elliott Wave interpretation will be invalid. Until that happens, the trend remains bullish, and the chart suggests continued upward momentum.
The current setup indicates MAHINDRA & MAHINDRA is likely to experience continued strength, as Gray Wave 5 unfolds after the completion of Gray Wave 4. The impulsive wave characteristics show strong buying activity, though caution is advised—since it’s a fifth wave, it may be the last leg of the current bullish trend within Orange Wave 3.
M&M Elliott Wave technical analysis [Video]
Author

Peter Mathers
TradingLounge
Peter Mathers started actively trading in 1982. He began his career at Hoei and Shoin, a Japanese futures trading company.


