MIN stock analysis and Elliott Wave analysis [Video]
![MIN stock analysis and Elliott Wave analysis [Video]](https://editorial.fxstreet.com/images/Markets/Equities/Ibex/bolsa-de-madrid-15680575.jpg)
ASX: MINERAL RESOURCES LIMITED - MIN Elliott Elliott Wave Technical Analysis TradingLounge
Greetings, Our Elliott Wave analysis today updates the Australian Stock Exchange (ASX) MINERAL RESOURCES LIMITED - MIN. We see MIN.ASX could be preparing to move up with wave (iii)-orange of wave ((iii))-navy.
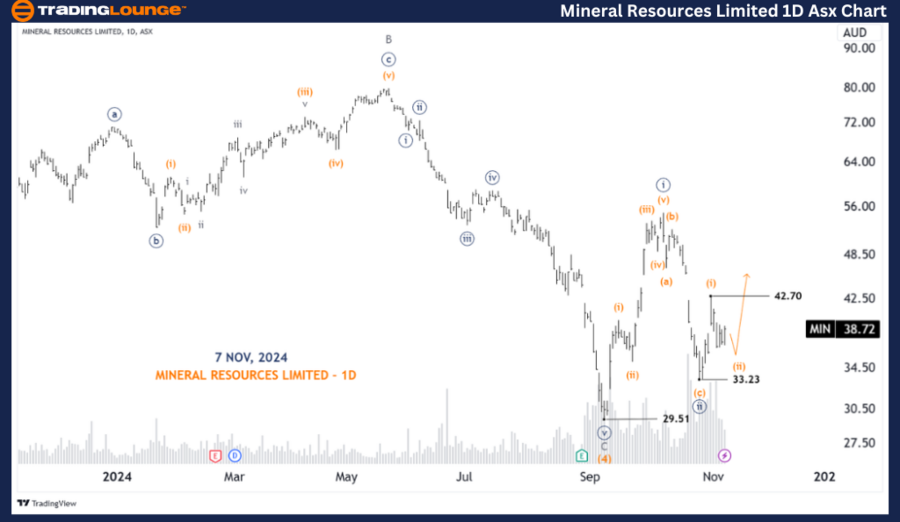
ASX: Mineral Resources Limited - MIN 1D chart (semilog scale) analysis
Function: Major trend (Minute degree, navy).
Mode: Motive.
Structure: Impulse.
Position: Wave (ii)-orange of Wave ((iii))-navy.
Details: Wave ((ii))-navy may have finished as (a)(b)(c)-orange Zigzag, and since 33.23 wave ((iii))-navy is unfolding to push higher, which itself is an Extended Waves, it is subdividing into wave (ii)-orange and will probably complete soon, after which wave (iii)-orange will push higher.
Invalidation point: 33.23.
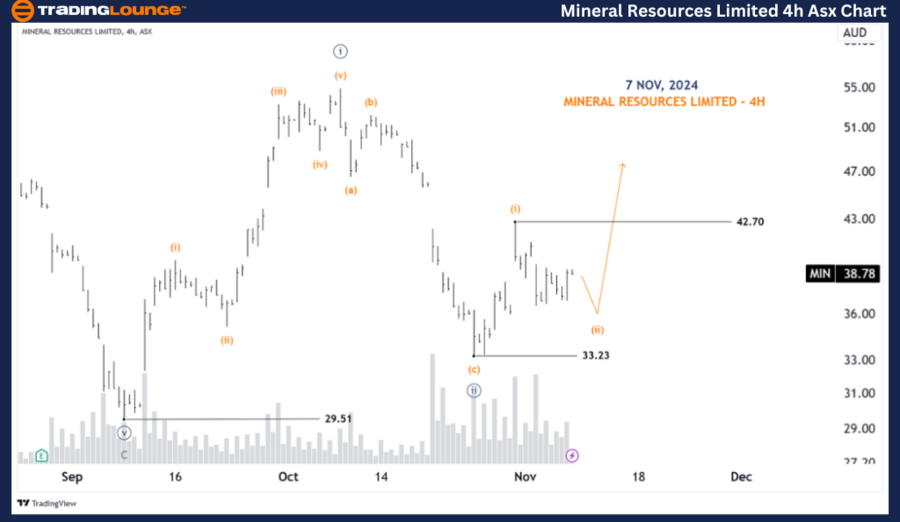
ASX: Mineral Resources Limited - MIN four-hour chart analysis
Function: Major trend (Minute degree, navy).
Mode: Motive.
Structure: Impulse.
Position: Wave (ii)-orange of Wave ((iii))-navy.
Details: Since the low of 33.23 wave ((iii))-navy is unfolding to push higher. It is subdividing into wave (ii)-orange itself, with the unstable development, it may push lower again, then wave (iii)-orange will return to push higher. Also a push above 42.70 will clarify the view that wave (iii)-orange is unfolding.
Invalidation point: 33.23.
Cofirmation point: 42.70.
Conclusion:
Our analysis, forecast of contextual trends, and short-term outlook for ASX: MINERAL RESOURCES LIMITED - MIN aim to provide readers with insights into the current market trends and how to capitalize on them effectively. We offer specific price points that act as validation or invalidation signals for our wave count, enhancing the confidence in our perspective. By combining these factors, we strive to offer readers the most objective and professional perspective on market trends.
Technical analyst: Hua (Shane) Cuong, CEWA-M (Master’s Designation).
ASX: Mineral Resources Limited - MIN chart analysis [Video]
Author

Peter Mathers
TradingLounge
Peter Mathers started actively trading in 1982. He began his career at Hoei and Shoin, a Japanese futures trading company.


