MicroStrategy (MSTR) bearish shift: The case for further weakness

Strategy Inc (NASDAQ: MSTR), formerly known as MicroStrategy, remains Bitcoin’s largest corporate holder. However, a stark divergence has emerged throughout 2025. While Bitcoin consistently notches new all-time highs, MSTR stock displays persistent weakness and failing momentum. This disconnect signals underlying technical damage.
Today, we analyze the bearish Elliott Wave sequence explaining this underperformance. Our analysis outlines the critical support levels and downside targets if this corrective phase continues.
Elliott Wave analysis
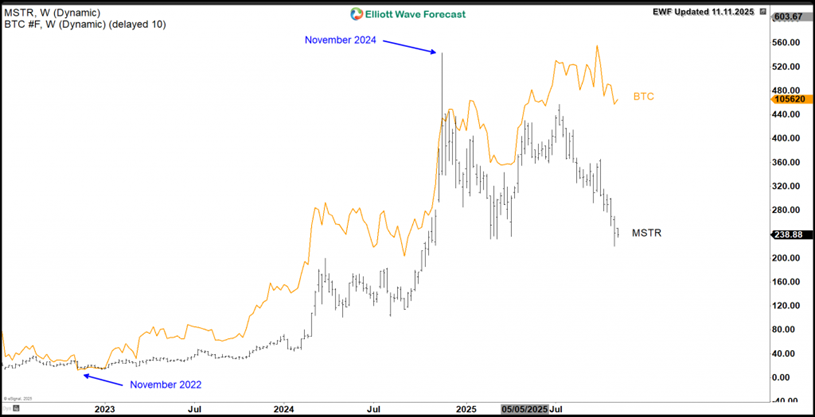
A clear positive correlation linked MSTR and Bitcoin since November 2022. However, this relationship fractured after two years. MicroStrategy peaked at $543 in November 2024. Subsequently, it entered a sideways trend. Meanwhile, Bitcoin continued climbing to new highs. Furthermore, MSTR made new yearly lows. In contrast, Bitcoin held firmly above its April 2025 low.
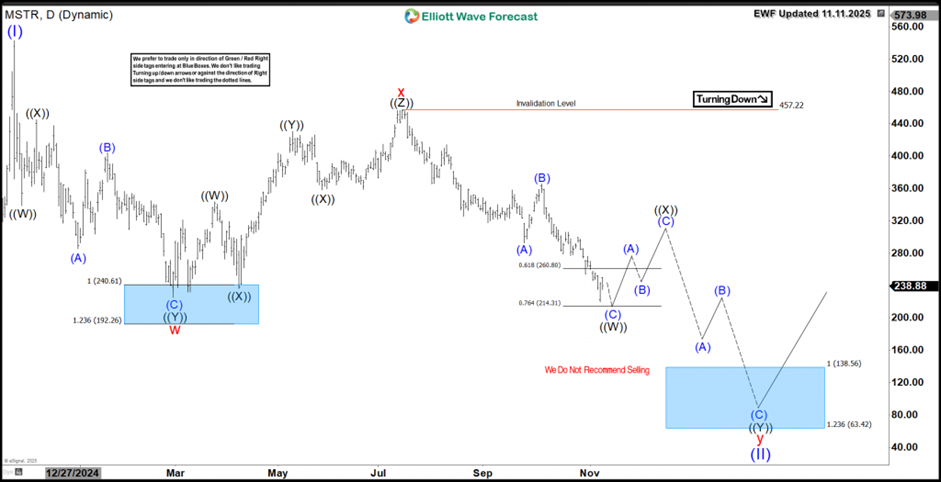
The MSTR daily chart shows a confirmed bearish sequence. Since the November 2024 peak, the stock has broken below the February 2025 low. This action confirms a larger double three correction is now in progress.
It completed wave “w” in February 2025. Then, wave” x” bounced higher. Currently, wave “y” remains in progress. Wave ((W)) reached the 61.8-76.4% Fibonacci zone. Consequently, a three-wave bounce in wave ((X)) is likely soon. However, the downtrend should then resume.
Ultimately, the equal legs target lies at $138 – $63. Once this buying area is reached, expect a strong reaction higher. Therefore, investors will likely position for the next uptrend. Ideally, this new rally will begin next year.
MSTR daily chart 11.11.2025
Conclusion
Strategy stock MSTR is undergoing a daily correction. Consequently, traders can use short-term bounces as selling opportunities. Meanwhile, investors should wait for the next extreme area before buying the stock. Use our Elliott Wave strategy to time entries with precision. Enter after a 3-, 7-, or 11-swing correction completes. Additionally, our proprietary Blue Box system highlights high-probability zones with pinpoint accuracy. As a result, this disciplined method gives traders the clarity and confidence to catch the next bullish leg.
Author

Elliott Wave Forecast Team
ElliottWave-Forecast.com


