MicroStrategy Inc. (MSTR) stocks Elliott Wave technical analysis [Video]
![MicroStrategy Inc. (MSTR) stocks Elliott Wave technical analysis [Video]](https://editorial.fxsstatic.com/images/i/Equity-Index_S&P500-2_XtraLarge.jpg)
MSTR Elliott Wave Analysis Trading Lounge.
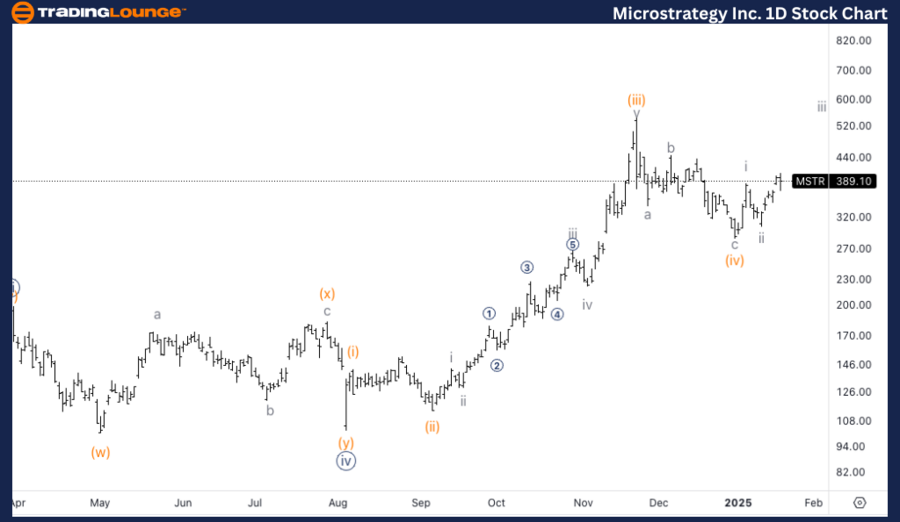
MicroStrategy Inc., (MSTR) Daily Chart.
MSTR Elliott Wave technical analysis
Function: Trend.
Mode: Impulsive.
Structure: Motive.
Position: Wave (v) of {v}.
Direction: Upside in wave (v).
Details: Looking for upside into wave iii of (v) as we go back approaching Trading Level 5 at 500$.
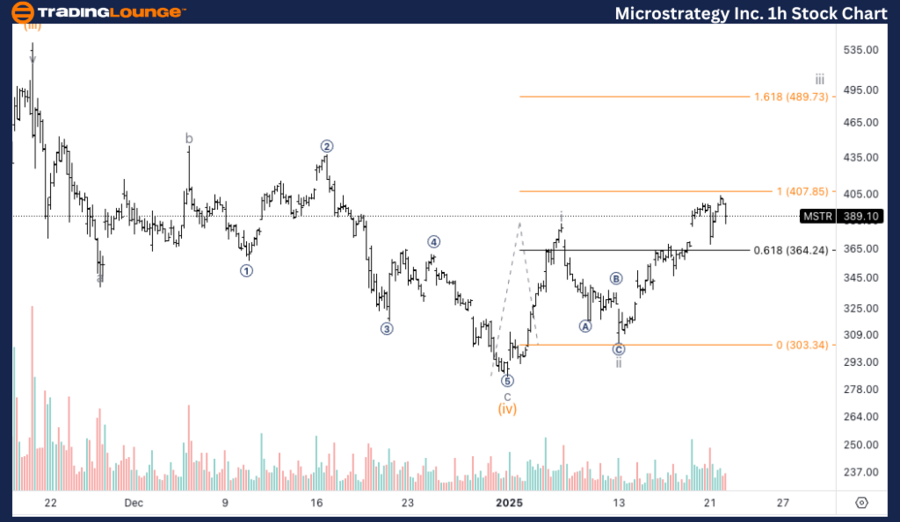
MicroStrategy Inc., (MSTR) 1H Chart.
MSTR Elliott Wave technical analysis
Function: Trend.
Mode: Impulsive.
Structure: Motive.
Position: Wave iii of (v).
Direction: Upside in wave iii.
Details: Looking for further upside into wave iii as we approach equality of iii vs. I which could provide resistance, especially as it could be a point of failure which would suggest a double correction lower.
This analysis focuses on the current trend structure of MicroStrategy Inc., (MSTR) utilizing the Elliott Wave Theory on both the daily and 1-hour charts. Below is a breakdown of the stock's position and potential future movements.
MSTR Elliott Wave technical analysis – Daily chart
MicroStrategy (MSTR) is showing strong bullish momentum as it continues into wave iii of (v), with upside targets nearing TradingLevel5 at $500. The continuation of this impulsive Elliott Wave pattern signals potential further gains for investors. Traders should watch closely for any resistance around the $500 mark as the stock moves towards this critical level.
MSTR Elliott Wave technical analysis – One-hour chart
MicroStrategy (MSTR) is expected to continue its upward trend as it progresses through wave iii of (v). The next potential resistance is the equality of wave iii vs. wave i, a critical level for traders. If this level is tested and fails to break, it could lead to a temporary double correction, but the overall trend remains bullish. Watch for price action and volume at key resistance levels to confirm continued strength in the uptrend.
Technical analyst: Alessio Barretta.
MSTR Elliott Wave technical analysis [Video]
Author

Peter Mathers
TradingLounge
Peter Mathers started actively trading in 1982. He began his career at Hoei and Shoin, a Japanese futures trading company.


