Microsoft (MSFT) forecasting the rally from the blue box area

In this technical article we’re going to take a quick look at the Elliott Wave charts of Microsoft (MSFT) stock. As our members know, the stock is trading within the cycle from the November 2022 low. We have been calling for the rally in the stock after 3 waves pull back. Our team recommended members to avoid selling MSFT stock, while keep favoring the long side. In the further text we are going to explain the Elliott Wave Forecast.
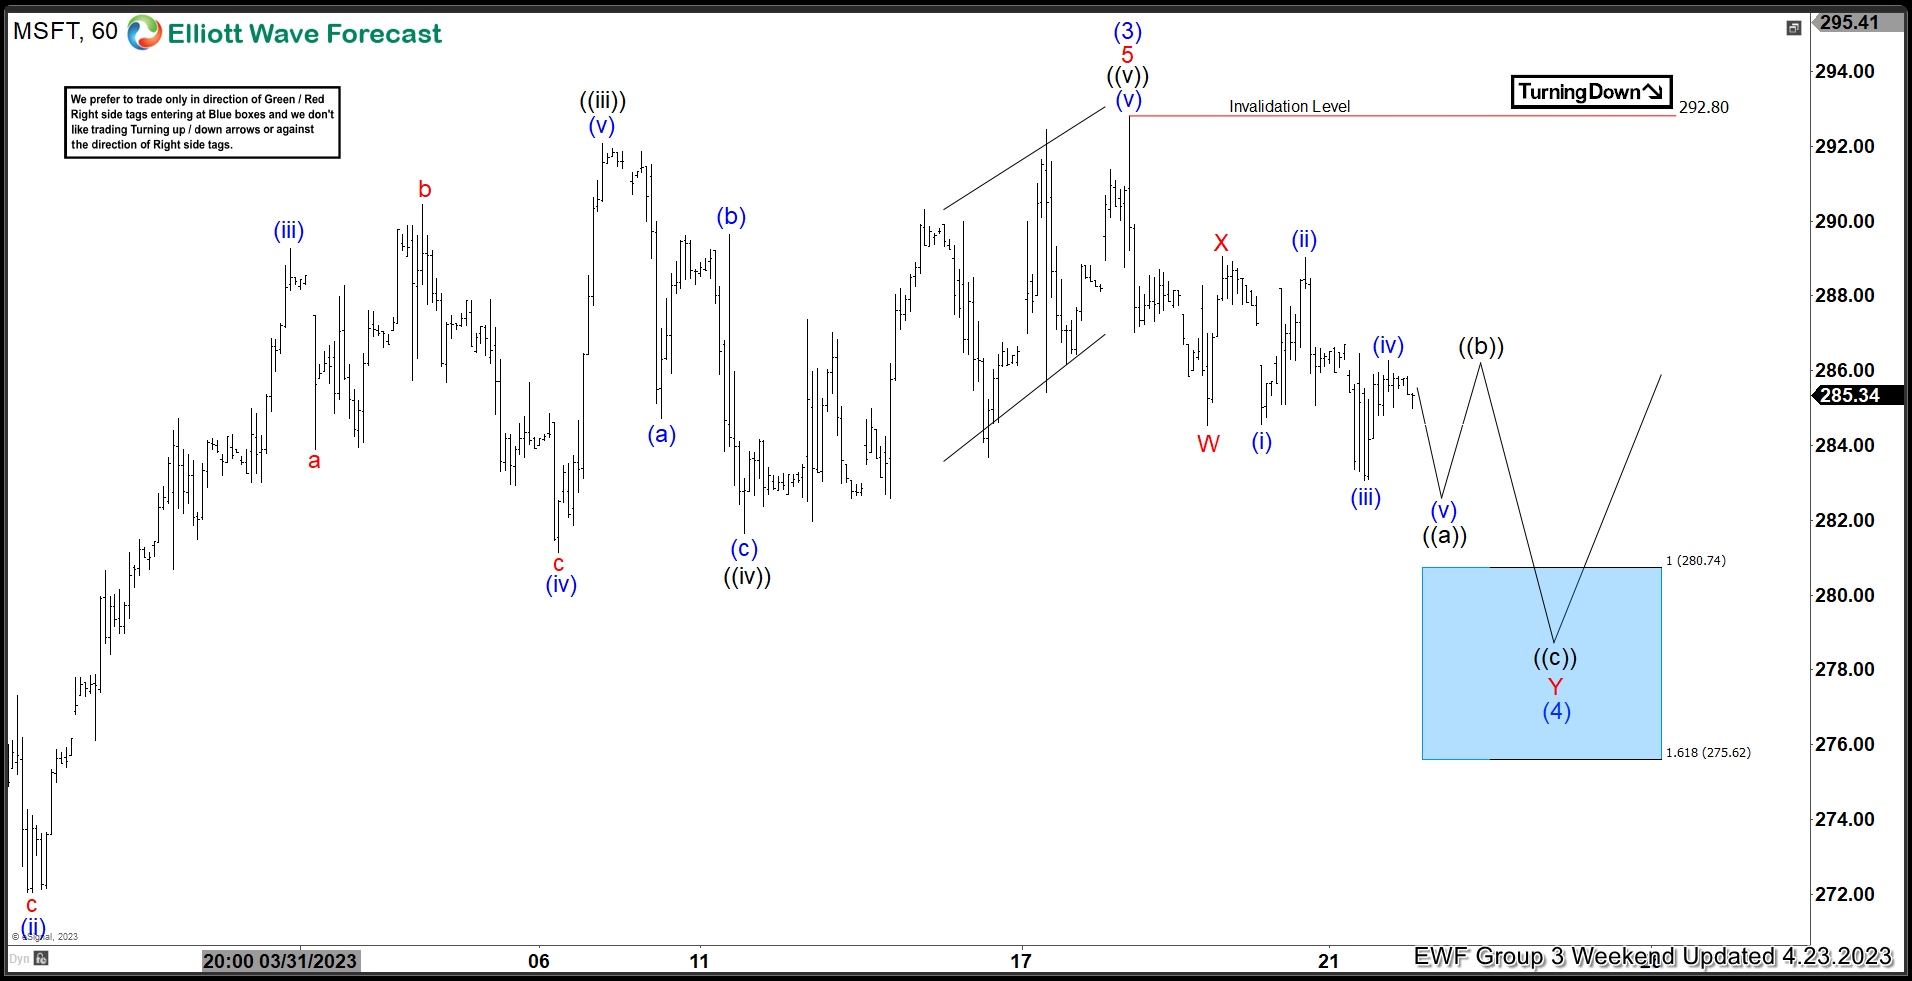
Microsoft (MSFT) Elliott Wave 1 hour chart 4.23.2023
Current view suggests the stock is doing wave (4) pull back, correcting the cycle from the March low. At the moment structure of the pull back looks incomplete, consequently we were calling for more downside toward 280.74-275.62 area. We don’t recommend selling it and prefer the long side. The stock is expected to find buyers in 3,7,11 swings. We expect to see at least 3 waves bounce from the blue box area or further rally toward new highs ideally.
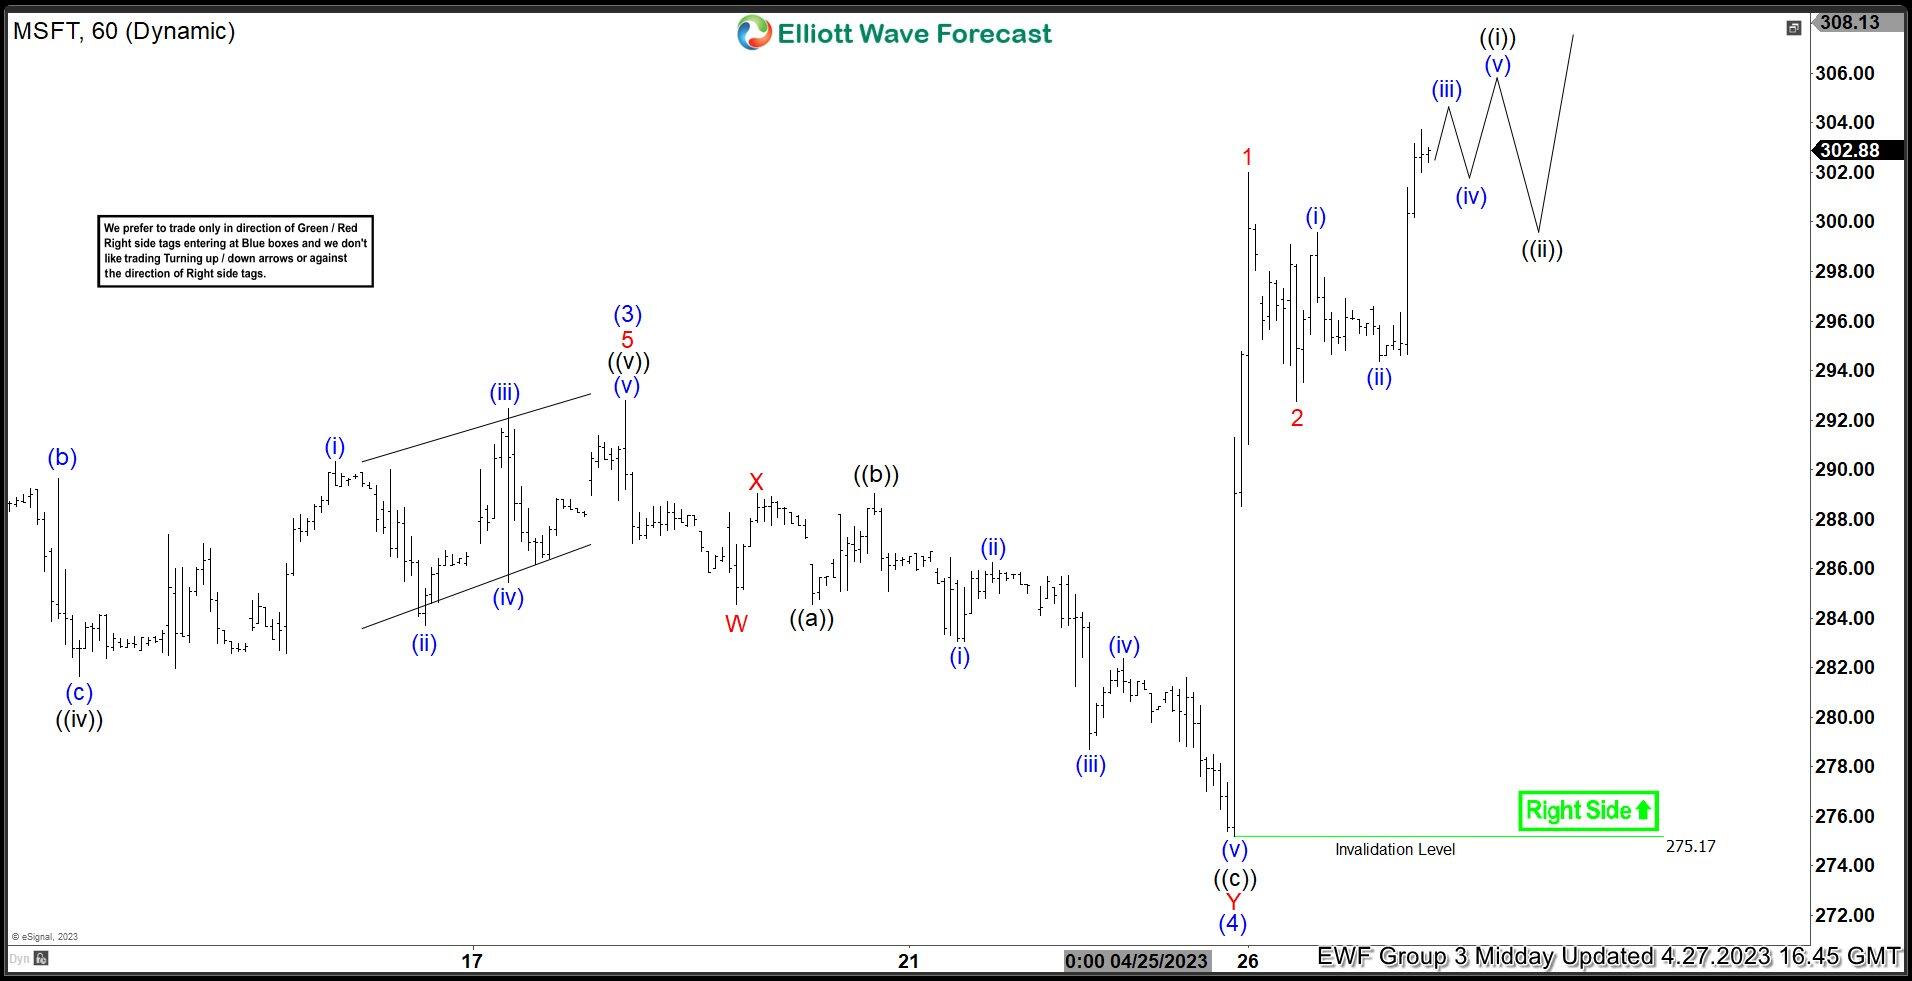
Microsoft (MSFT) Elliott Wave 1 hour chart 4.23.2023
Eventually the stock made decline toward blue box zone- buyers area. Pull back reached our target zone at 280.74-275.62 area . MSFT found buyers and we got very good reaction from there. Rally made break toward new highs confirming next leg up is in progress. The stock is expected to keep finding buyers as far as pivot at 275.17 low holds.
Author

Elliott Wave Forecast Team
ElliottWave-Forecast.com


