Mexican Peso falls after release of mid-month inflation data
- The Mexican Peso weakens following lower core inflation data against a backdrop of negative fundamentals.
- USD/MXN pulls back after testing the 20.00 hurdle. The pair remains in a broader uptrend.

The Mexican Peso (MXN) trades marginally lower on Thursday after the release of Mexican mid-month core inflation showed price rises fell to 3.87% YoY from 3.95% previously. Headline inflation, however, rose slightly to 4.69% from 4.66% previously, according to INEGI.
The dip in core data is expected to increase the chances of the Bank of Mexico (Banxico) cutting interest rates by 0.25% at the next policy meeting in Novermber, although the decision could hinge on the outcome of the US elections. Such a cut would be negative for MXN since lower interest rates reduce foreign capital inflows.
"The fall in Mexican core services inflation in the first half of October in principle gives Banxico space to press ahead with another 25bp rate cut next month, but much will hinge on the outcome of the US election," said Kimberley Sperrfechter, Emerging Markets Economist for advisory service Capital Economics in a note on the release.
The Peso is weakening again following a brief reversal on Wednesday, in which it first fell to a one-month low against the US Dollar (USD) but then recovered – partly due to technical buying – and rose an average of about half a percent in its most heavily-traded pairs – the USD/MXN, EUR/MXN and GBP/MXN. A revival of the carry trade due to the recent depreciation in the Japanese Yen (JPY) might be a further factor in the Peso’s recovery.
Mexican Peso recovers: Potential revival of the carry trade?
The Mexican Peso executed a surprising volte face in its key pairs on Wednesday and trades mixed on Thursday. One possible explanation for the recovery, given MXN’s negative fundamentals, is the weakness experienced by the Japanese Yen, which could be reviving investor interest in the carry trade and, as a result, raising demand for the Peso.
The Mexican currency tends to be a key beneficiary of carry flows because of its relatively high interest rates offered to depositors in Mexico, influenced by The Bank of Mexico’s (Banxico) cash rate, which is 10.50%. This compares to only 0.25% in Japan, where interest rates are stuck at low levels due to endemic deflation.
The carry operation involves borrowing capital in a low-interest currency, such as the Japanese Yen, and using the money to buy a higher interest-paying alternative, such as the Mexican Peso. The difference between the cost of servicing the Yen-denominated loan and the interest earned on the MXN investment generates a profit (10.50% - 0.25% = 10.25%), assuming no change in the exchange rate. If the Yen weakens or the Peso strengthens, however, the carry trade becomes even more profitable.
Mexican Peso still vulnerable to bearish fundamentals
The Mexican Peso remains vulnerable to multiple bearish fundamental factors.
Data released this week painted a gloomy picture of the Mexican economy after both Economic Activity and Retail Sales fell sharply in August. This reinforces the negative economic outlook forecast by the IMF for Mexico in its recent reports for 2024 and 2025.
Weak growth will likely weigh on the Mexican Peso and pressure Banxico to lower interest, which would reduce foreign capital inflows.
Uncertainty over the outcome of the US election is a further negative factor for the Peso now that former President Donald Trump has bounced back after falling behind in the polls. Trump has said he will use tariffs to limit foreign imports, particularly of Mexican-made cars, which would be negative for the Peso. According to election website FiveThirtyEight.com, the latest poll held by Forbes on October 21-22 put Trump one point ahead on 49%, versus Vice President Kamala Harris’s 48%.
Technical Analysis: USD/MXN pulls back but momentum remains with bulls
USD/MXN is pulling back after flirting with the 20.00 level. However, it overall remains in an uptrend within a rising channel, which, given the technical dictum “the trend is your friend,” is eventually likely to resume and push the price to higher highs.
USD/MXN Daily Chart
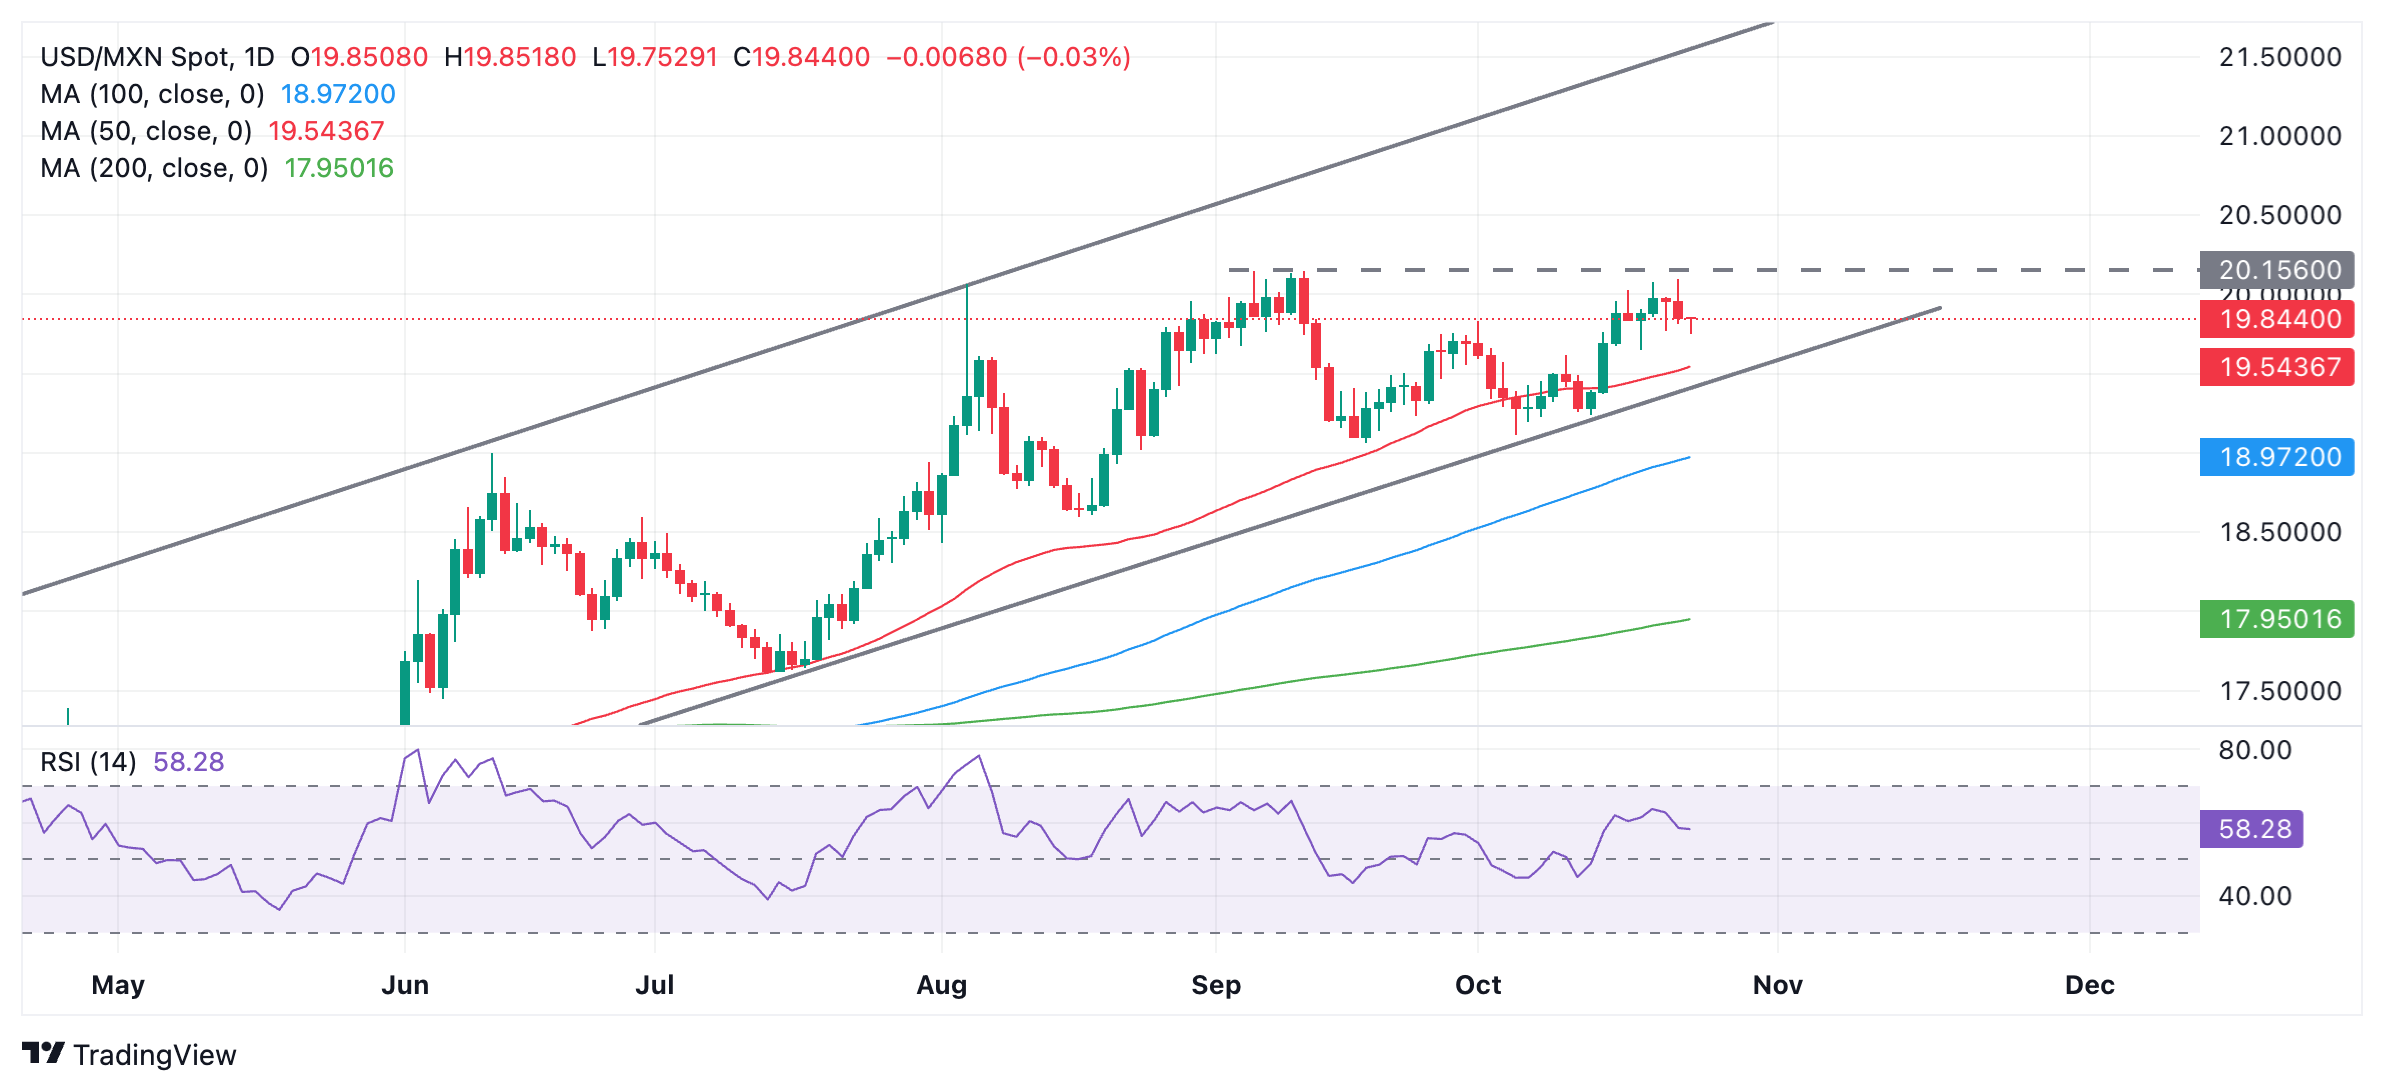
The Relative Strength Index (RSI) indicator in the daily chart remains relatively elevated, signaling momentum remains bullish. At the moment, this further supports the view that the pullback will only be a temporary stumbling block for the uptrend before it resumes its upside bias.
The break above 19.83 (October 1 high) has confirmed a probable move up to the next target in the vicinity of the September 10 high at 20.13.
Interest rates FAQs
Interest rates are charged by financial institutions on loans to borrowers and are paid as interest to savers and depositors. They are influenced by base lending rates, which are set by central banks in response to changes in the economy. Central banks normally have a mandate to ensure price stability, which in most cases means targeting a core inflation rate of around 2%. If inflation falls below target the central bank may cut base lending rates, with a view to stimulating lending and boosting the economy. If inflation rises substantially above 2% it normally results in the central bank raising base lending rates in an attempt to lower inflation.
Higher interest rates generally help strengthen a country’s currency as they make it a more attractive place for global investors to park their money.
Higher interest rates overall weigh on the price of Gold because they increase the opportunity cost of holding Gold instead of investing in an interest-bearing asset or placing cash in the bank. If interest rates are high that usually pushes up the price of the US Dollar (USD), and since Gold is priced in Dollars, this has the effect of lowering the price of Gold.
The Fed funds rate is the overnight rate at which US banks lend to each other. It is the oft-quoted headline rate set by the Federal Reserve at its FOMC meetings. It is set as a range, for example 4.75%-5.00%, though the upper limit (in that case 5.00%) is the quoted figure. Market expectations for future Fed funds rate are tracked by the CME FedWatch tool, which shapes how many financial markets behave in anticipation of future Federal Reserve monetary policy decisions.
Author

Joaquin Monfort
FXStreet
Joaquin Monfort is a financial writer and analyst with over 10 years experience writing about financial markets and alt data. He holds a degree in Anthropology from London University and a Diploma in Technical analysis.


