Meta Platforms Stock Forecast: Snap earnings failure hits META, TTD
- Snap lost 27% following its Q3 earnings call.
- Meta Platforms has followed suit, dropping 3.7%.
- The Trade Desk has also lost 4%.

Meta Platforms (META) is down 3.7% in Friday's premarket at $126.62. Once again the collapse in the ur-social media company's share price can be blamed on Snap (SNAP). The latter's earnings call late Thursday forced it to sell off more than 27% afterhours when management refused for the second quarter in a row to provide guidance for the following quarter. This poor performance has seeped into the market's outlook on both Meta Platforms stock and The Trade Desk (TTD). The latter is a digital advertising marketplace that fell 4% in the premarket. Both companies were affected negatively last quarter as well due to poor Snap earnings news. TTD, however, quickly rebounded last quarter on its own earnings call.
Snap did miss revenue projections by a slight $10 million, but overall the rest of earnings were farely decent. The company beat consensus on both earnings and active daily users. Operating income, adjusted EBITDA and free cash flow, however, suffered compared to a year earlier.
Meta Platforms stock forecast
META stock has had a horrible year so far, but it is now sitting on support from November and December of 2018. Bargain basement value pickers might get interested at this level, since it holds such precedence on the monthly chart below. A break here would send shares down to support at $115 from late 2016. Isn't that something? META always seems to be finding its multi-year low at the very end of the year. It happened in 2016, 2018 and....maybe 2022. Resistance remains between $160 and $180. Lastly, it is significant that this is the first time that META stock has ever touched the oversold level on the monthly Relative Strength Index (RSI) indicator. Could this be another sign of a bottom?
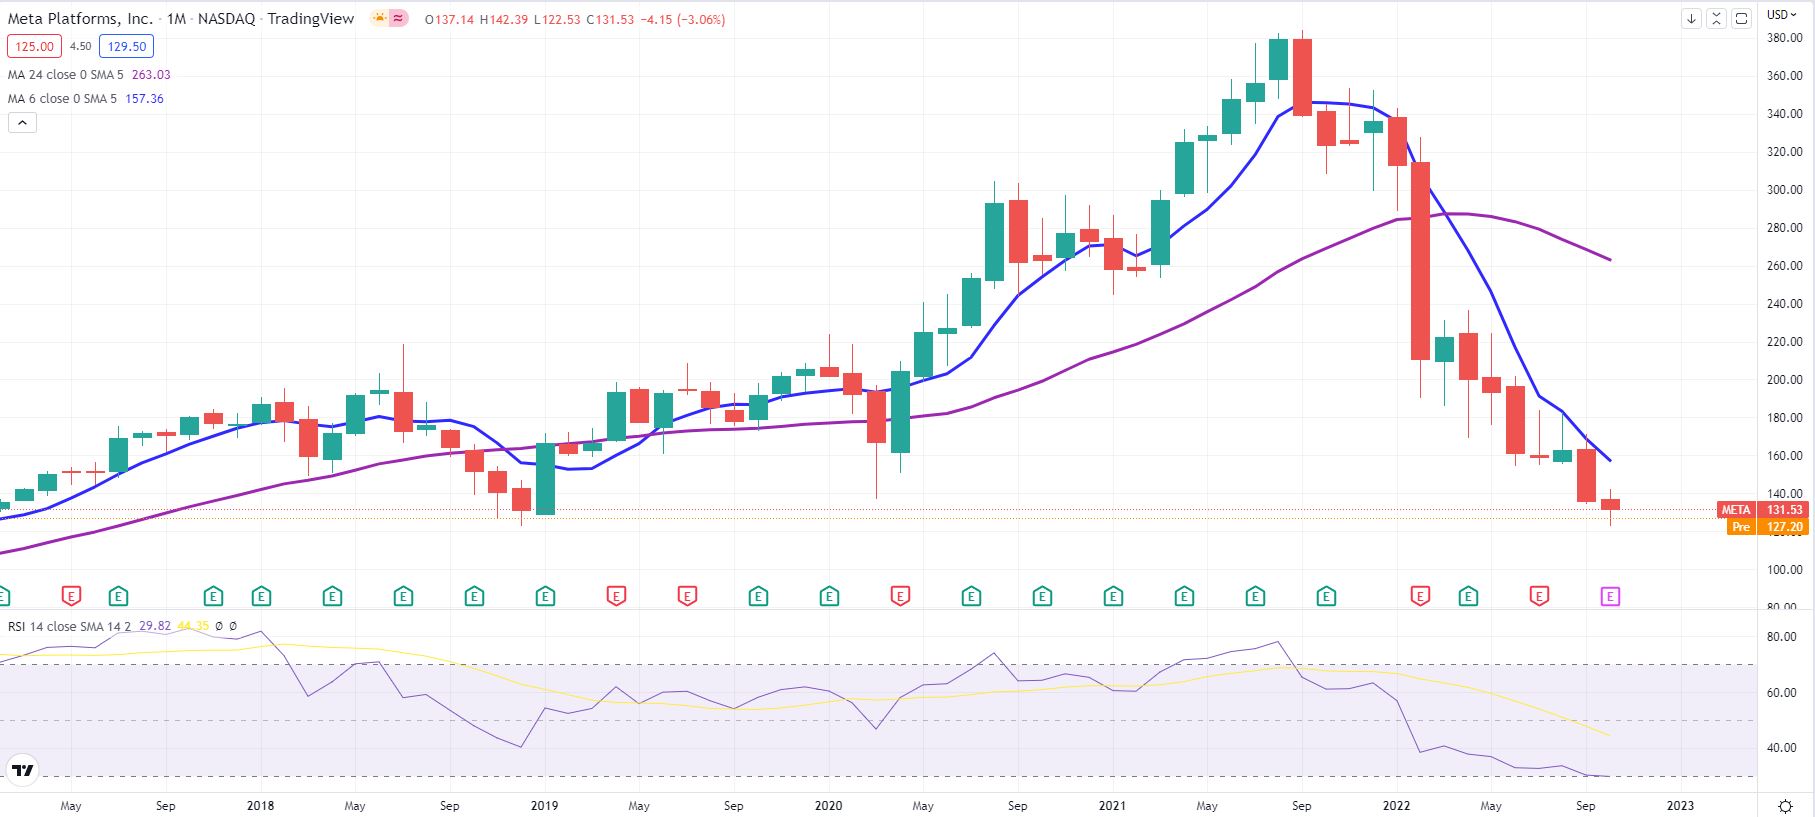
META monthly chart
The Trade Desk stock forecast
The Trade Desk stock is in a much healthier place compared with META. First, the 8-week moving average is still above the 30-week. This is a rarity among tech stocks in this down cycle. Second, TTD might have alread put in a higher low last week. At least, that is what it looks like.
This would be a fantastic case for shareholders since it would mean that the new support level is $50 rather than $40 from July. Last of all, the Moving Average Convergence Divergence (MACD) indicator looks to be popping above the 50 level soon, which is typically a bullish signal. A real bear market rally could push shares back up to the recent resistance zone around $74.
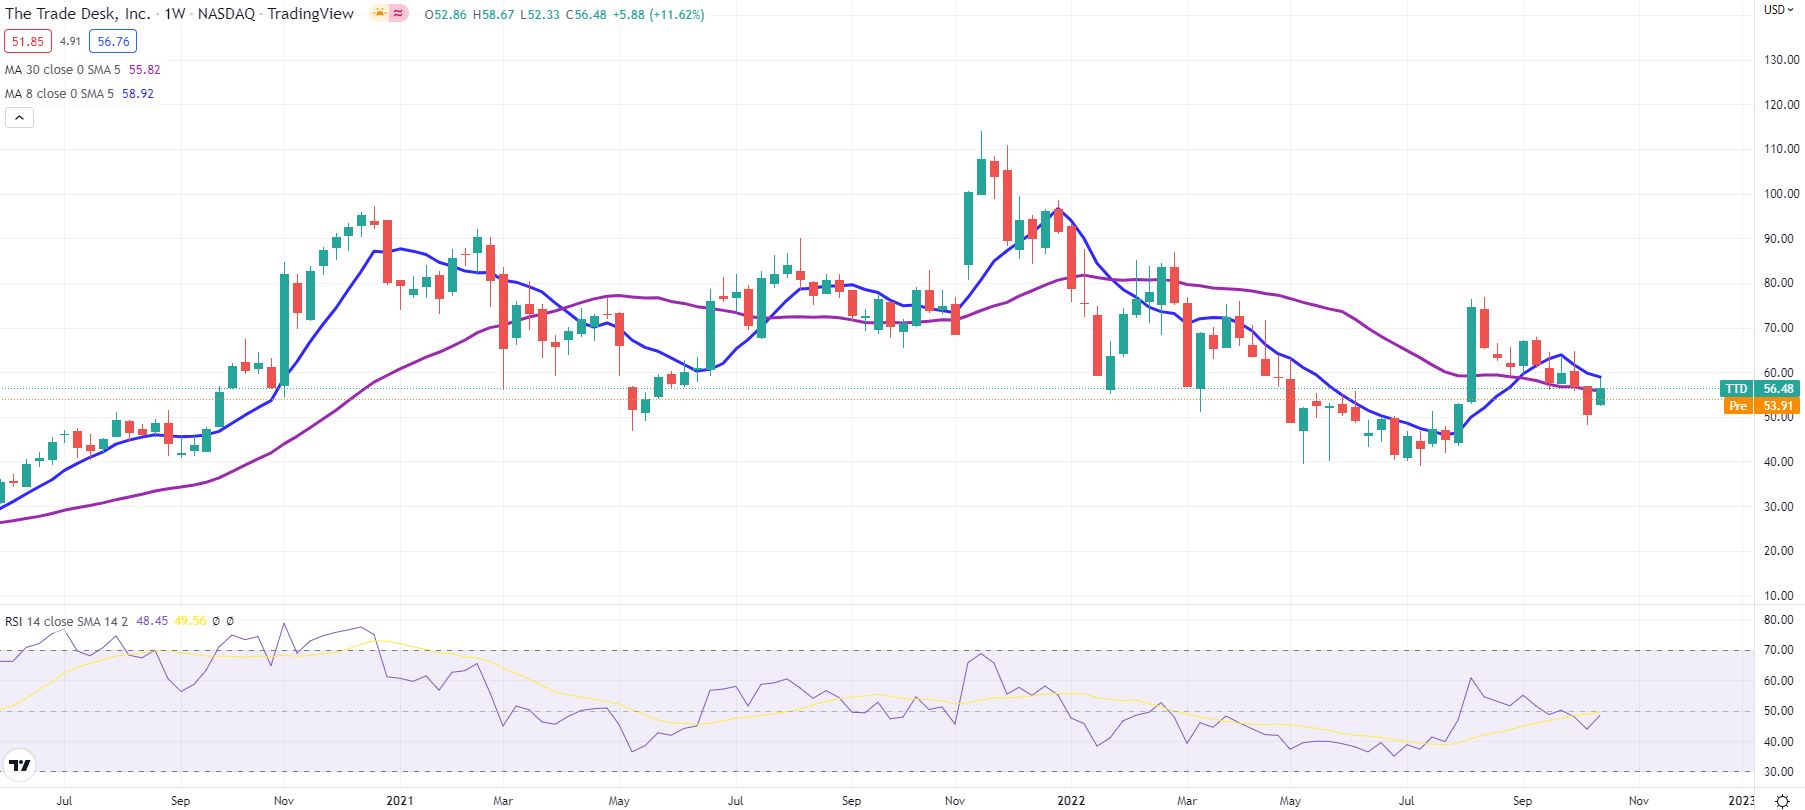
TTD weekly chart
Premium
You have reached your limit of 3 free articles for this month.
Start your subscription and get access to all our original articles.
Author

Clay Webster
FXStreet
Clay Webster grew up in the US outside Buffalo, New York and Lancaster, Pennsylvania. He began investing after college following the 2008 financial crisis.


