Meta Platforms Inc. (META) Elliott Wave technical analysis [Video]
![Meta Platforms Inc. (META) Elliott Wave technical analysis [Video]](https://editorial.fxstreet.com/images/TechnicalAnalysis/ChartPatterns/Chartism/bull-market-financial-data-24404899_XtraLarge.jpg)
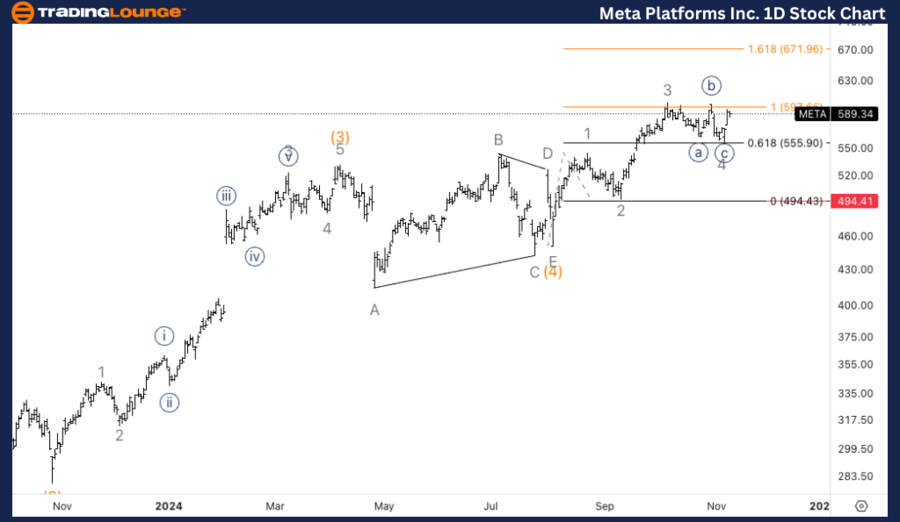
META Elliott Wave technical analysis
Function: Trend
Mode: Impulsive
Structure: Motive
Position: Intermediate wave (5)
Direction: Upside in 5 of (5).
Details: We have been looking at a post triangle thrust within wave 5. It’s possible we are actually completing wave 1 of (5) instead of 5 of (5). Nevertheless, we are still missing one more leg higher, ideally to reach 650$.
META Elliott Wave technical analysis – Daily chart
The daily chart for Meta Platforms suggests we are in the final stages of wave (5) of an impulsive move. While the initial analysis points to the completion of wave 5 of (5), it’s possible we are instead completing wave 1 of (5). Regardless, one more leg higher is expected, ideally pushing the price towards the 650$ target. This scenario aligns with a post-triangle thrust, indicating bullish momentum is likely to continue in the short term.
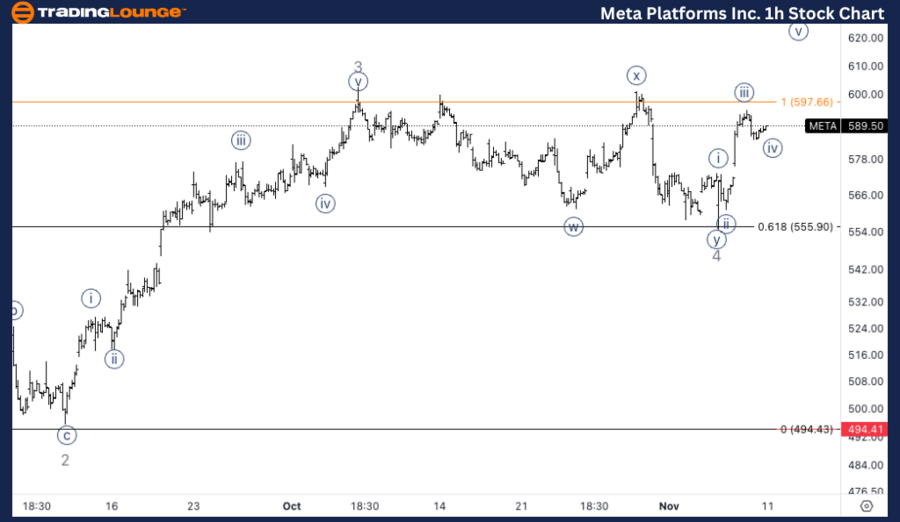
META Elliott Wave technical analysis
Function: Trend.
Mode: Impulsive.
Structure: Motive.
Position: Wave {iv} of 5.
Direction: Upside in wave {v}.
Details: Looking for upside into wave {v}. We seem to be missing one leg higher in what could either be a top in wave {v} of 5, or else a top in wave (v) of {i}, which would be the preferred scenario, considering the target at MediumLevel 650$.
META Elliott Wave technical analysis – One-hour chart
The 1-hour chart indicates that Meta is in the process of completing wave {iv} and is preparing for an upward move in wave {v}. The missing leg higher in wave {v} suggests we are nearing the completion of either wave 5 of (5) or wave (v) of {i}, with the latter being the preferred scenario. This would indicate further bullish continuation, particularly towards the MediumLevel of 650$, which serves as a potential resistance level.
This Elliott Wave analysis for Meta Platforms Inc., (META) examines both the daily and 1-hour charts to assess its current market trend, utilizing Elliott Wave Theory to anticipate potential future movements.
Meta Platforms Inc. (META) Elliott Wave technical analysis [Video]
Author

Peter Mathers
TradingLounge
Peter Mathers started actively trading in 1982. He began his career at Hoei and Shoin, a Japanese futures trading company.


