McDonald’s Corp. (MCD) Elliott Wave technical analysis [Video]
![McDonald’s Corp. (MCD) Elliott Wave technical analysis [Video]](https://editorial.fxstreet.com/images/i/bearish-line_XtraLarge.png)
MCD Elliott Wave technical analysis
- Function: Trend.
-
Mode: Impulsive.
-
Structure: Motive.
-
Position: Wave (3) of 5.
-
Direction: Upside within wave (3).
-
Details:
-
Seeking confirmation of wave (2) bottom after a clear three-wave move.
-
Expecting further upside into wave 1 of (3) to validate wave (3)’s uptrend continuation.
-
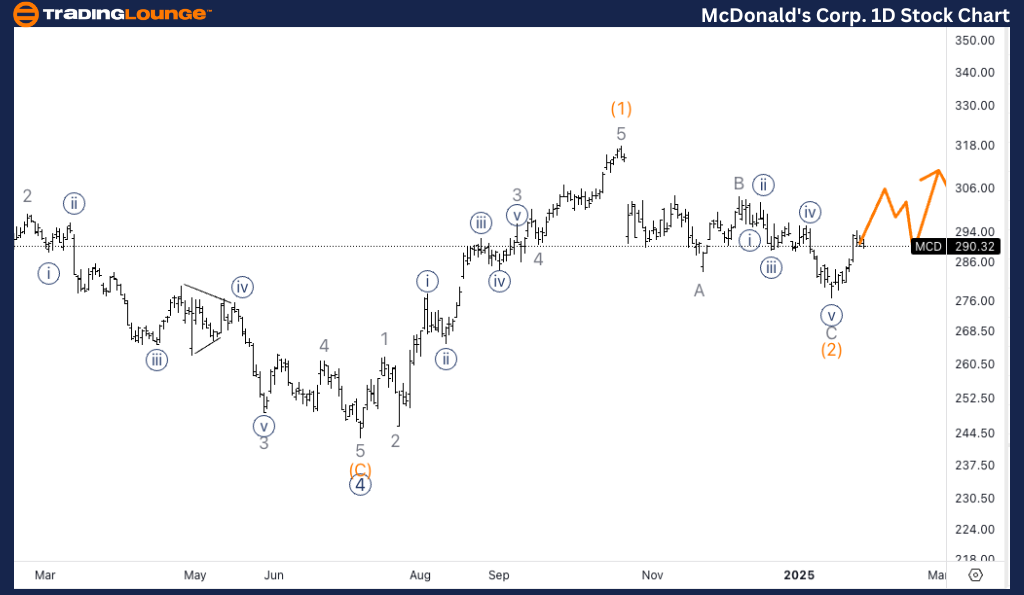
McDonald’s Corp. (MCD) Elliott Wave analysis – Daily chart
MCD Elliott Wave technical analysis
- Function: Trend.
-
Mode: Impulsive.
-
Structure: Motive.
-
Position: Wave (iv) of {iii}.
-
Direction: Upside in wave (v).
-
Details:
-
Anticipating wave (iv) completion soon.
-
Expecting further upside in wave (v) toward TradingLevel3 at $300.
-
This Elliott Wave Analysis of McDonald's Corp. (MCD) provides insights based on both the daily and 1-hour charts, helping traders understand market trends and price forecasts.
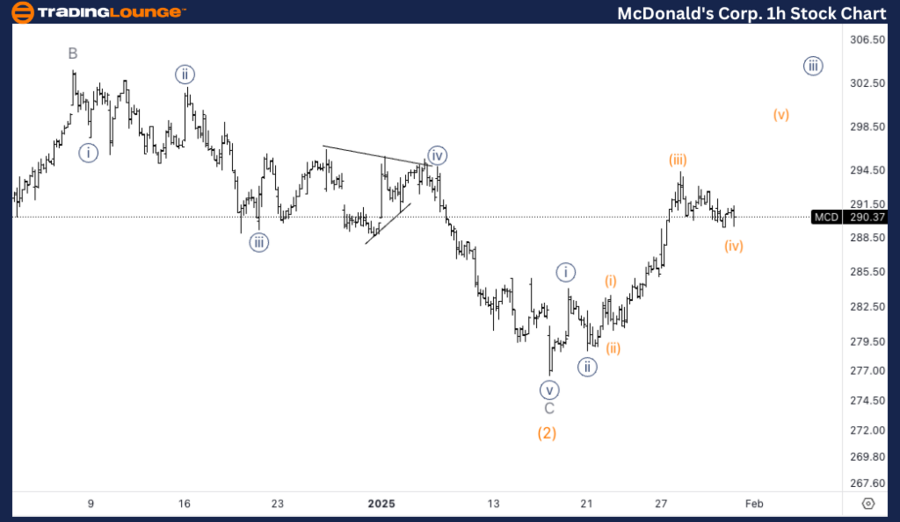
McDonald’s Corp. (MCD) Elliott Wave analysis – One-hour chart
Summary
The analysis outlines key trends across multiple equities, indicating both corrective and impulsive movements. The S&P 500 stocks examined here exhibit a mix of trend continuations and corrections, providing trading opportunities across different phases of the Elliott Wave Cycle.
McDonald’s Corp. (MCD) Elliott Wave technical analysis [Video]
Author

Peter Mathers
TradingLounge
Peter Mathers started actively trading in 1982. He began his career at Hoei and Shoin, a Japanese futures trading company.


