Mahindra & Mahindra – M&M Elliott Wave technical analysis [Video]
![Mahindra & Mahindra – M&M Elliott Wave technical analysis [Video]](https://editorial.fxsstatic.com/images/i/india-01_XtraLarge.jpg)
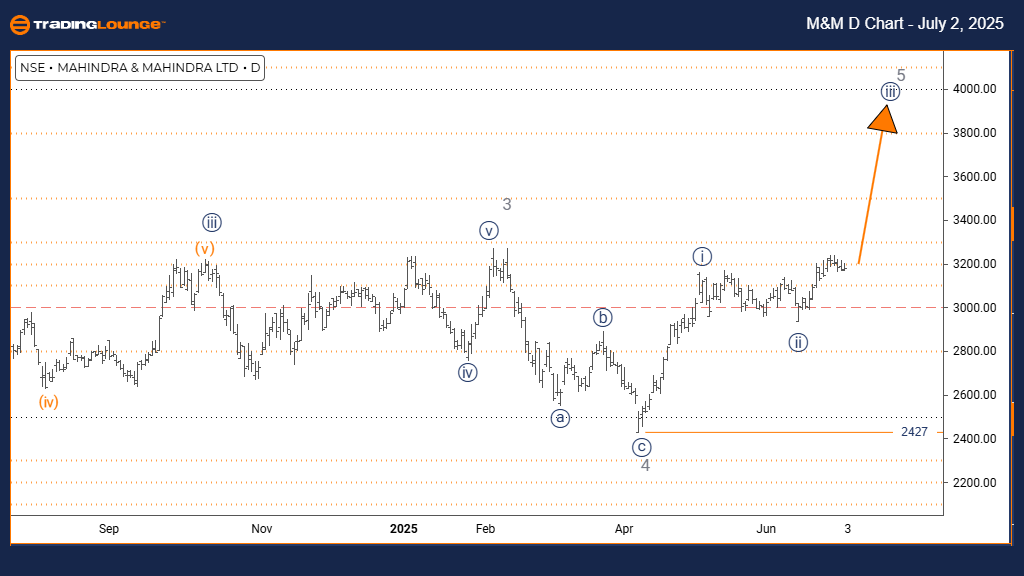
Mahindra & Mahindra Elliott Wave analysis – Day chart
Function: Bullish Trend.
Mode: Impulsive.
Structure: Navy Blue Wave 3.
Position: Gray Wave 5.
Next higher degree direction: Navy Blue Wave 3 (In Progress).
Details: Navy Blue Wave 2 appears complete. Now, Navy Blue Wave 3 of Gray Wave 5 is active.
Wave cancel invalidation level: 2427.
The daily Elliott Wave analysis for MAHINDRA & MAHINDRA indicates a bullish outlook. The stock is currently exhibiting impulsive behavior, implying strong upward momentum. The ongoing wave structure is identified as Navy Blue Wave 3, which forms part of the broader Gray Wave 5 cycle. This configuration points to a strong rally during the final stages of the current bullish wave.
Navy Blue Wave 2 looks to have finished its corrective movement. With this completion, the market has shifted into Navy Blue Wave 3 of Gray Wave 5. Typically, the third wave in Elliott Wave theory carries strong directional momentum. The analysis now focuses on tracking Navy Blue Wave 3 as it unfolds inside the larger Gray Wave 5 progression.
The key invalidation level is set at 2427. A drop below this point would negate the current Elliott Wave structure, prompting a reevaluation of the bullish scenario. Until that level is breached, the wave pattern continues to support an upward movement.
The current chart setup favors further upside potential for MAHINDRA & MAHINDRA. With the impulsive Navy Blue Wave 3 underway, following the completion of Navy Blue Wave 2, this could suggest growing buying interest. However, since this movement forms the third wave within a fifth wave, it may indicate that the bullish cycle is nearing its completion.
Mahindra & Mahindra – Elliott Wave analysis – Weekly chart
Function: Bullish Trend.
Mode: Impulsive.
Structure: Gray Wave 5.
Position: Orange Wave 3.
Next lower degree direction: Orange Wave 4.
Details: Gray Wave 4 appears completed. Now, Gray Wave 5 is active.
Wave cancel invalidation level: 2427.
The weekly Elliott Wave analysis for MAHINDRA & MAHINDRA confirms a bullish outlook. The current market behavior shows impulsive characteristics, reflecting strong upward momentum. The ongoing structure is Gray Wave 5, which aligns within the broader sequence of Orange Wave 3. This setup implies that the stock is in the final upward phase of its present bullish pattern, which often involves notable price growth.
According to the analysis, Gray Wave 4 has ended its corrective move. Now, the stock has entered Gray Wave 5, the last leg in the Elliott Wave pattern. This phase typically shows heightened momentum before a potential reversal or broader correction. The next likely move within lower degrees is Orange Wave 4, which should begin after Gray Wave 5 completes.
Traders should closely watch the invalidation level at 2427. If the price drops below this mark, the current wave structure will be invalid, requiring a re-evaluation of the bullish thesis. As long as the price remains above this point, the wave structure supports a continued upward move.
This technical setup suggests a possible strong upside for MAHINDRA & MAHINDRA, with Gray Wave 5 now underway after Gray Wave 4’s completion. The impulsive nature of this wave signals increasing buying activity. However, as it represents a fifth wave inside Orange Wave 3, it might be a signal that the bullish cycle is nearing its final stage.

Mahindra & Mahindra – M&M Elliott Wave technical analysis [Video]
Author

Peter Mathers
TradingLounge
Peter Mathers started actively trading in 1982. He began his career at Hoei and Shoin, a Japanese futures trading company.


