$LBS: Lumber prices in a historic double correction

Lumber, also known as timber, is a type of wood that has been processed into beams and planks. One can trade it in form of Random Length Lumber futures and options at Chicago Mercantile Exchange within the agriculture asset class under the ticker $LBS. In 2020, we saw commodities turning higher. Since January 2021, rally in US Dollar executes pressure on commodity prices in general and on agriculture prices in particular. As a matter of fact, the lumber saw the ups and downs. In May 2021, it has printed the all-time highs at 1711.2. Then, it has seen the low in August 2021 at 448. In the last article from November 2021, we have expected a rally to happen. Indeed, the lumber prices reached higher towards 1477.4 in March 2022 without breaking to new all-time highs. Now, we see a larger correction taking place. Here, we provide an updated view of a historic double correction against the zero level.
Lumber monthly Elliott Wave analysis 10.18.2022
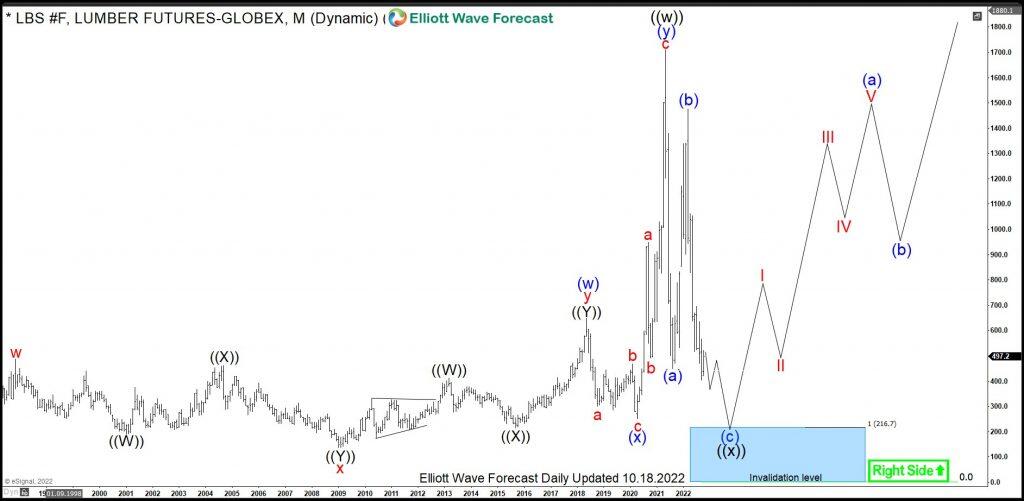
The monthly chart below shows the lumber front contract LBS #F. From the all-time lows, the prices have developed a cycle higher in blue wave (w) of a super cycle degree. It is a choppy and overlapping structure in series of 3. Therefore, the best count is to see the advance towards May 2018 highs at 648.5 as a double three pattern. From there, a correction lower in wave (x) has ended in April 2020 at 251.5. From the lows, a break to the new all-time highs has confirmed a new cycle higher in blue wave (y). Hereby, wave (y) has extended in 3 impressively strong swings towards the new all-time highs in May 2021 at 1711.2.
From the all-time highs in May 2021, a pullback in wave (a) has brought the prices down to 448 lows. The timber has lost 74% off the highs in only 3 months. From the lows, the bounce in wave (b) has failed below May 2021 highs. Now, wave (c) of ((x)) is still in progress and it provides a historic opportunity to enter the market for long term investors.
For 2023-2030, the expectations are to see the end of the consolidation and more upside within a new cycle as black wave ((y)). Investors should target 1711.2 highs and beyond in the long run.
Lumber daily Elliott Wave analysis 10.18.2022
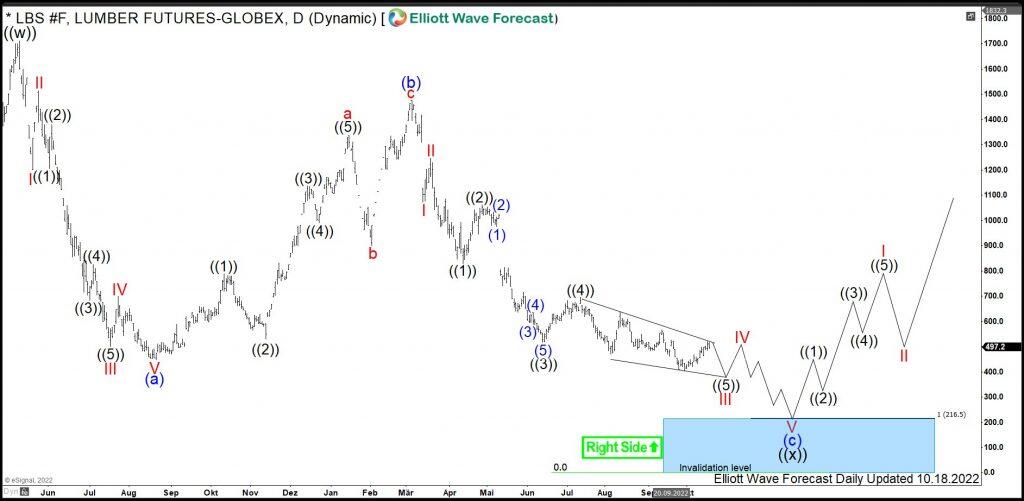
The daily chart below shows in more detail the pullback from the all-time highs within black wave ((x)). From the high at 1711.2, the decline is an Elliott wave zigzag pattern being a 5-3-5 structure. Firstly, blue wave (a) has printed a bottom at 448 low in August 2021. Secondly, three swings of a blue wave (b) have set a connector at 1477.4 in March 2022. Then, a decline in blue wave (c) has broken 448 lows opening up a bearish sequence. Now, the prices should extend lower to complete the sequence.
Investors and traders can be looking to buy $LBS from 216.5-0.0 area for a rally targeting 1711.2 highs and beyond in the long run.
Author

Elliott Wave Forecast Team
ElliottWave-Forecast.com


