|

Key levels and divergences: What the S&P 500 chart is telling us

Price patterns in technical analysis are valuable tools for uncovering potential trading opportunities. These patterns can manifest across various time frames, making them useful for short- and long-term traders. For instance, a day trader may leverage multiple time frame analyses within intraday data to pinpoint strategic entry and exit points. Meanwhile, long-term traders might focus on weekly and monthly data to detect possible trend reversals, allowing them to take informed actions to safeguard their portfolios.

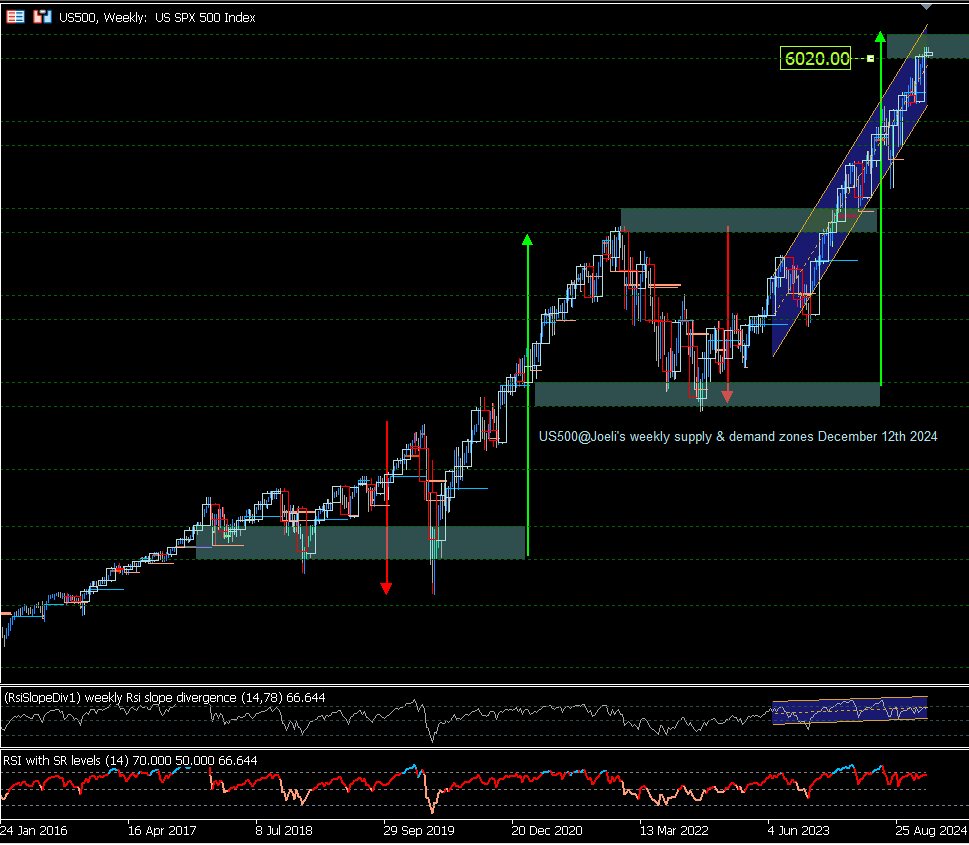
A closer look at the attached combined S&P 500 weekly and monthly chart reveals a compelling example of a long-term price pattern that originated in 2017. Traders should pay attention to the critical 6020 zone highlighted on the chart, as a failure to maintain this level could signal a repetition of past patterns. Additionally, price divergence must be given special attention, which occurs when the index reaches new highs while the relative strength index (RSI) registers lower lows. This divergence can be a telltale sign of underlying market weakness. For instance, during the significant correction in 2021, the S&P 500 experienced a drop of over 25% before it eventually rebounded and resumed its upward trajectory, forming the current pattern.

While identifying market reversals isn't always straightforward, combining price patterns with additional analytical tools—such as volume profiles and supply and demand zones—can enhance a trader's ability to recognise potential trend changes. This synergistic approach allows traders and investors to prepare effectively for shifts in market direction, positioning themselves to adjust their strategies accordingly.

Chart

Author

Denis Joeli Fatiaki

Denis Joeli Fatiaki

Independent Analyst

Denis Joeli Fatiaki possesses over a decade of extensive experience as a multi-asset trader and Market Strategist.

More from Denis Joeli Fatiaki
Share:

Markets move fast. We move first.

Orange Juice Newsletter brings you expert driven insights - not headlines. Every day on your inbox.

By subscribing you agree to our Terms and conditions.

Editor's Picks

EUR/USD recovers to 1.1750 region as 2025 draws to a close

Following the bearish action seen in the European session on Wednesday, EUR/USD regains its traction and recovery to the 1.1750 region. Nevertheless, the pair's volatility remains low as trading conditions thin out on the last day of the year.

GBP/USD stays weak near 1.3450 on modest USD recovery

GBP/USD remains under modest beairsh pressure and fluctuates at around 1.3450 on Wednesday. The US Dollar finds fresh demand due to the end-of-the-year position adjustments, weighing on the pair amid the pre-New Year trading lull. 

Gold retreats to $4,300 area, looks to post monthly gains

Gold stays on the back foot on the last day of 2025 and trades near $4,300, possibly pressured by profit-taking and position adjustments. Nevertheless, XAU/USD remains on track to post gains for December and extend its winning streak into a fifth consecutive month.

Bitcoin, Ethereum and XRP prepare for a potential New Year rebound

Bitcoin, Ethereum, and Ripple are holding steady on Wednesday after recording minor gains on the previous day. Technically, Bitcoin could extend gains within a triangle pattern while Ethereum and Ripple face critical overhead resistance. 

Economic outlook 2026-2027 in advanced countries: Solidity test

After a year marked by global economic resilience and ending on a note of optimism, 2026 looks promising and could be a year of solid economic performance. In our baseline scenario, we expect most of the supportive factors at work in 2025 to continue to play a role in 2026.

Crypto market outlook for 2026

Year 2025 was volatile, as crypto often is.  Among positive catalysts were favourable regulatory changes in the U.S., rise of Digital Asset Treasuries (DAT), adoption of AI and tokenization of Real-World-Assets (RWA).