JSW Steel Elliott Wave technical analysis [Video]
![JSW Steel Elliott Wave technical analysis [Video]](https://editorial.fxsstatic.com/images/i/charts-01_XtraLarge.jpg)
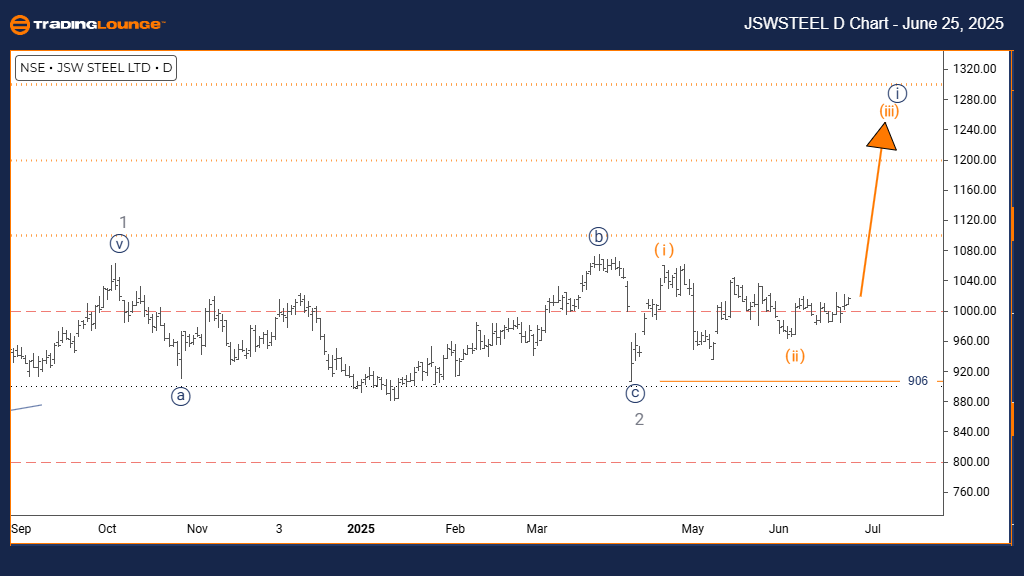
JSW Steel Elliott Wave analysis – Daily chart
-
Function: Bullish Trend.
-
Mode: Impulsive.
-
Structure: Orange Wave 3.
-
Position: Navy Blue Wave 1.
-
Direction next higher degrees: Orange Wave 3 (initiated).
-
Details: Orange Wave 2 appears complete; now, Orange Wave 3 is underway.
-
Wave cancel invalid level: 906.
Wave structure overview
The daily Elliott Wave analysis of JSW STEEL indicates a bullish trend. The price movement is currently within an impulsive phase, signaling robust upward momentum. The chart identifies the ongoing structure as Orange Wave 3, part of a larger framework defined by Navy Blue Wave 1. This position implies that JSW STEEL is advancing within a dominant bullish market phase.
Transition to orange wave 3
Analysis confirms the completion of Orange Wave 2’s correction, indicating the start of Orange Wave 3. This wave typically showcases the strongest, most extended movement in an Elliott Wave sequence. It is crucial to observe Orange Wave 3 as it evolves within the overarching Navy Blue Wave 1 structure.
Key support level
The critical invalidation level is set at 906. If the price falls below this level, the current wave interpretation becomes invalid, necessitating a reevaluation of the bullish outlook. Until then, the Elliott Wave pattern remains aligned with continued price growth.
Outlook
JSW STEEL’s technical setup currently supports a sustained uptrend. With Orange Wave 3 activated after the completion of Orange Wave 2, this impulsive wave suggests continued buying pressure and the potential for significant price advances.
JSW Steel Elliott Wave technical analysis – Four hour chart
-
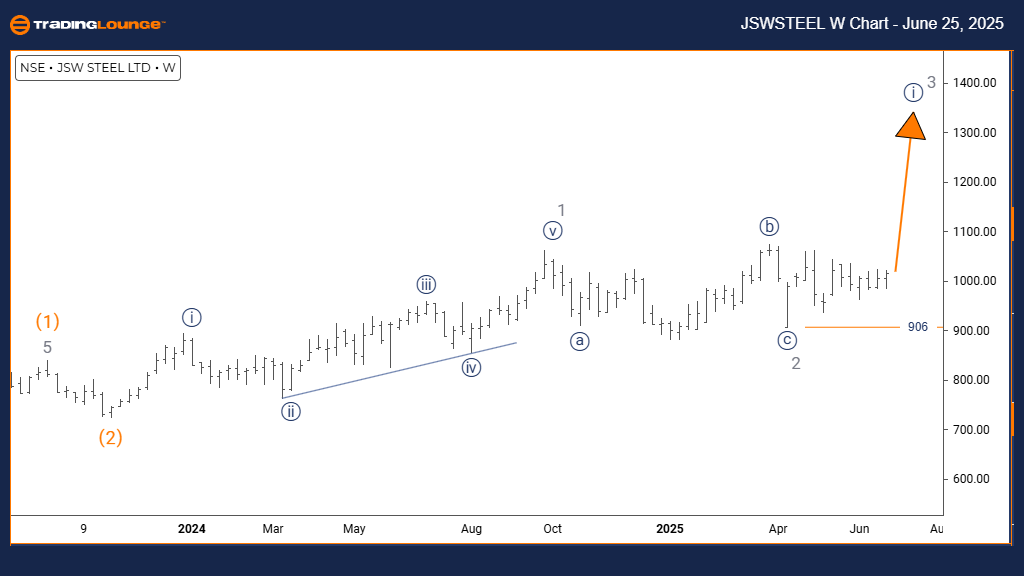
Function: Bullish Trend.
-
Mode: Impulsive.
-
Structure: Navy Blue Wave 1.
-
Position: Gray Wave 3.
-
Direction next lower degrees: Navy Blue Wave 2.
-
Details: Gray Wave 2 appears to have ended; Navy Blue Wave 1 of Gray Wave 3 is now in motion.
-
Wave cancel invalid level: 906.
Wave structure overview
The weekly Elliott Wave analysis for JSW STEEL indicates a bullish market scenario. The price trend remains in impulsive mode, pointing to strong momentum. The active wave structure is labeled Navy Blue Wave 1, which is nested within a broader Gray Wave 3. This setup suggests that the stock could be in the early stages of a significant new upward phase in a larger bullish cycle.
Initiation of gray wave 3
Gray Wave 2 has completed its correction, giving way to Navy Blue Wave 1 within Gray Wave 3. This sequence represents the beginning of the third wave pattern, often marked by the strongest price movement in Elliott Wave theory. The next projected phase at a lower degree is Navy Blue Wave 2, which should follow the completion of the current wave.
Key support level
The key invalidation point for this wave analysis is at 906. If prices drop below this level, the current count would be deemed invalid, necessitating a reassessment of the chart. Until then, the current structure supports a continued move higher.
Outlook
JSW STEEL appears to be in the early stages of a possible significant uptrend. Navy Blue Wave 1 is now active within Gray Wave 3, suggesting increased institutional demand and the potential for ongoing gains as the pattern evolves.
JSW Steel Elliott Wave technical analysis [Video]
Author

Peter Mathers
TradingLounge
Peter Mathers started actively trading in 1982. He began his career at Hoei and Shoin, a Japanese futures trading company.


