JPM Elliott Wave technical analysis [Video]
![JPM Elliott Wave technical analysis [Video]](https://editorial.fxstreet.com/images/Markets/Equities/FTSE/british-money-and-stock-exchange-graph-17512709_XtraLarge.jpg)
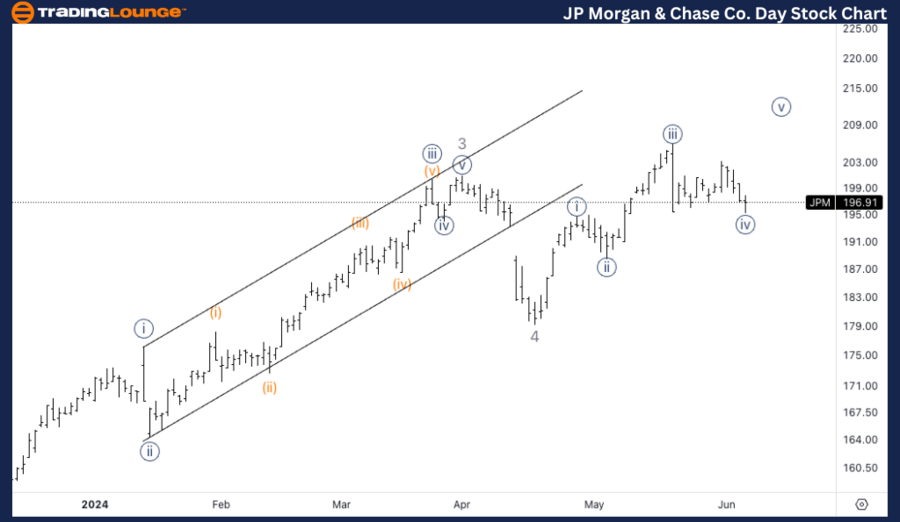
JPM Elliott Wave Analysis Trading Lounge Daily Chart,
JP Morgan & Chase Co., (JPM) Daily Chart
JPM Elliott Wave technical analysis
Function: Trend.
Mode: Impulsive.
Structure: Motive.
Position: Minor wave 5.
Direction: Top in wave 5.
Details: Looking for upside into wave 5 to complete a large uptrend. If not we could start to fall back down to complete a flat wave 4.
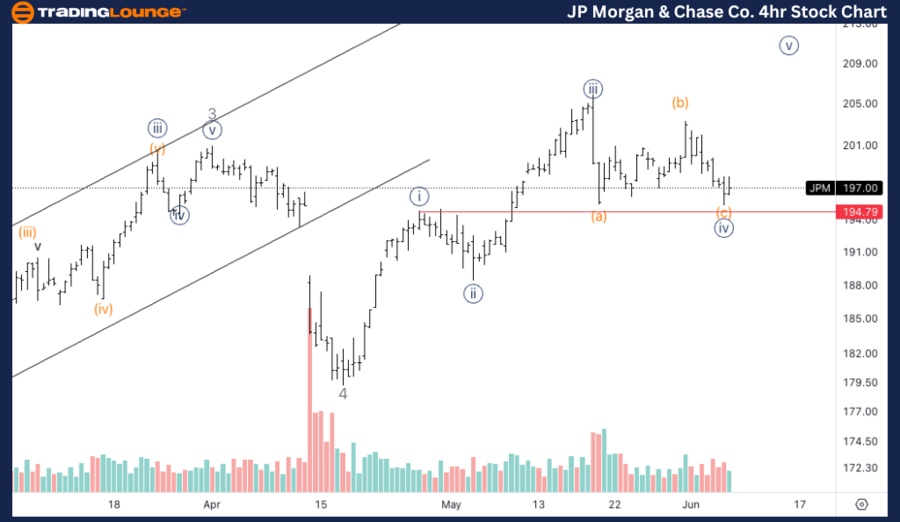
JPM Elliott Wave Analysis Trading Lounge 4Hr Chart,
JP Morgan & Chase Co., (JPM) 4Hr Chart
JPM Elliott Wave technical analysis
Function: Counter Trend.
Mode: Corrective.
Structure: Flat.
Position: Wave (c) of {iv}.
Direction: Bottom in wave (c).
Details: Looking for a bottom soon, or else we will cross invalidation level at 194.8$, volume seems to be suggesting a potential bottom.
Welcome to our latest Elliott Wave analysis for JPMorgan Chase & Co. (JPM) as of June 7, 2024. This analysis provides an in-depth look at JPM's price movements using the Elliott Wave Theory, helping traders identify potential opportunities based on current trends and market structure. We will cover insights from both the daily and 4-hour charts to offer a comprehensive perspective on JPM's market behavior.
META Elliott Wave technical analysis – Daily chart
In our Elliott Wave analysis of JPMorgan Chase & Co. (JPM), we observe an impulsive trend characterized by a motive structure. JPM is currently positioned in Minor wave 5, which suggests the potential completion of a large uptrend. As JPM seeks to complete wave 5, there is an upside bias, but traders should also be cautious of the possibility of falling back down to form a flat wave 4 if the current uptrend does not sustain. Monitoring key resistance levels will be crucial for validating the upward trajectory and ensuring the completion of wave 5.
META Elliott Wave technical analysis – Four-hour chart
On the 4-hour chart, JPM is following a counter-trend corrective mode within a flat structure, specifically in wave (c) of {iv}. The current analysis indicates that JPM is approaching a potential bottom in wave (c). The critical invalidation level is at $194.80, and volume analysis suggests a potential bottom formation. Traders should watch for confirmation signals of a bottom around this level, which could provide a strategic entry point for long positions anticipating the start of the next impulsive wave.
Technical analyst: Alessio Barretta
JPM Elliott Wave technical analysis [Video]
Author

Peter Mathers
TradingLounge
Peter Mathers started actively trading in 1982. He began his career at Hoei and Shoin, a Japanese futures trading company.


