Johnson & Johnson stock sinks back to 200-day moving average on third talc verdict
- Johnson & Johnson stock sold off over 5% on Tuesday.
- A Texas court stopped the company from allowing its talc subsidiary to file for bankruptcy.
- This was the third time JNJ had attempted to conclude its talc lawsuits via bankruptcy court.
- Reuters reports that pharma companies might get a gradual road toward 25% tariffs.

Johnson & Johnson (JNJ) stock dropped back to the 200-day Simple Moving Average (SMA) on Tuesday after the company’s attempt to place its former talc business in bankruptcy failed for the third time.
A judge in Texas dismissed the healthcare giant’s case to get rid of tens of thousands of lawsuits that claim Johnson & Johnson’s talc-based baby powder caused cancer. This means that the parent company will likely face financial claims separately at trial that could end up costing more than the $9 billion it has agreed to pay.
The US stock market rebounded in the late morning trade on Tuesday after shedding weight soon after the open. The Dow Jones Industrial Average (DJIA) has gained 0.25% at the time of writing, while the NASDAQ Composite is up 1.00%.
Johnson & Johnson stock news
Johnson & Johnson had created a subsidiary to own all of its talc assets called Red River Talc. It then agreed with 83% of claimants to file for bankruptcy and then fund the subsidiary with $9 billion to be divided up among claimants. This legal strategy is sometimes called a Texas Two-Step.
The 83% of “yes” votes is key since the law requires 75% of claimants to agree to this type of plan. However, US Bankruptcy Court Judge Christopher Lopez concluded that Johnson & Johnson had not given claimants enough time to decide on their vote.
The company’s attempt to have Red River Talc file for bankruptcy has already failed twice at a similar court in New Jersey.
"The decision to litigate every filed case is based on the simple fact that this is a fake claim created by greedy plaintiff lawyers looking for another deep pocket to sue and fueled by litigation-financed attorney advertising," J&J Worldwide Vice President of Litigation Erik Haas said in a statement.
In a good sign for the company, Reuters is reporting that pharmaceutical companies are likely to win a slight reprieve from the Trump administration. While the White House is expected to place 25% tariffs on the import of most foreign goods, sources tell Reuters that pharma companies will likely see tariffs rise gradually to 25% rather than facing a sudden cliff. This will allow pharma companies to reshore their production of precursors and active ingredients back to the United States over the next year.
Johnson & Johnson stock forecast
Johnson & Johnson stock broke through the 50-day SMA on Tuesday but halted before the 200-day SMA. This gives the 200-day more significance but also means that a break of that purple line will cause even heavier selling.
Further support lies at the recent lows from December and January between $140.50 and $142.50.
JNJ stock needs to overtake the former support level at $162.50 to remove itself from the technical downtrend.
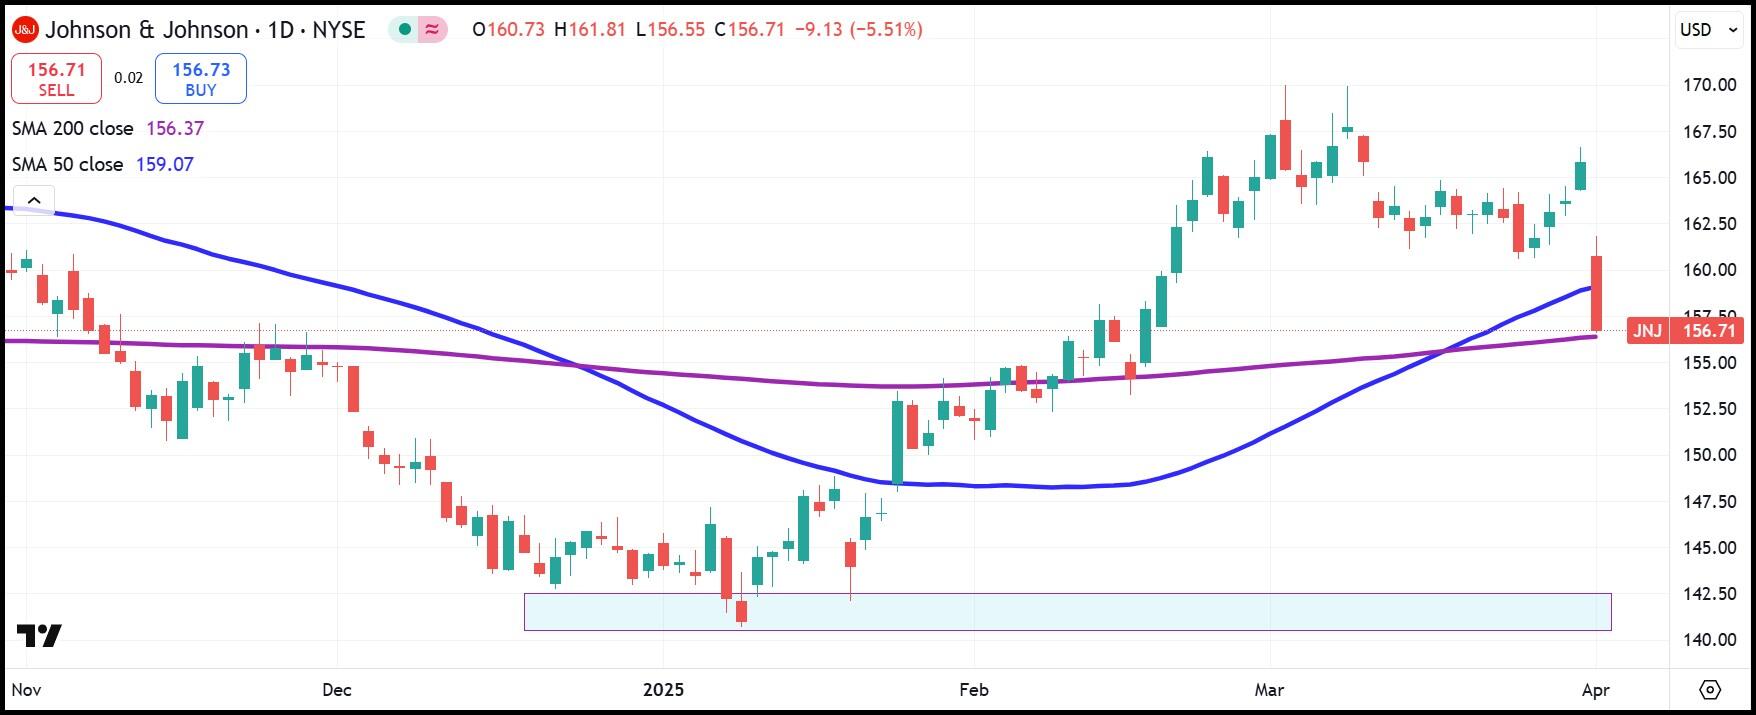
JNJ daily stock chart
Author

Clay Webster
FXStreet
Clay Webster grew up in the US outside Buffalo, New York and Lancaster, Pennsylvania. He began investing after college following the 2008 financial crisis.
















