Japanese Yen plummets to fresh one-month low against USD after US and China agree to lower tariffs
- The Japanese Yen kicks off the new week on a weaker note amid the US-China trade deal optimism.
- The Fed’s hawkish pause and easing US recession fears underpin the USD and support USD/JPY.
- The selling bias picks up pace following the US-China joint statement on trade arrangements.

The Japanese Yen (JPY) adds to intraday losses and touches a fresh one-month low against its American counterpart heading into the European session on Monday as the US-China trade deal optimism continues to weigh on safe-haven assets. Apart from this, worries about Japan's growth outlook on the back of US tariffs uncertainty turn out to be another factor weighing on the JPY.
Meanwhile, the positive outcome from high-stakes US-China trade talks helps ease market concerns about the US recession. This, along with the Federal Reserve's (Fed) hawkish pause earlier this month, lifts the US Dollar (USD) to its highest level since April 10. The combination of supporting factors lifts the USD/JPY pair above mid-146.00s and supports prospects for additional gains.
Japanese Yen continues losing ground on the back of positive US-China trade developments
- According to the joint statement released by the US and China, the US will modify application of the rate of duty on articles of China and only a 10% base tariffs rate will be applied. China will also suspend its tariffs on the US for an initial period of 90 days
- The optimism further boosts the upbeat market mood at the start of a new week, which is evident from strong gains around the equity markets and, in turn, is seen undermining demand for traditional safe-haven assets, including the Japanese Yen.
- Meanwhile, positive developments help to ease market concerns that an all-out trade war might trigger a US recession. Adding to this, the Federal Reserve's hawkish signal that it is not leaning towards cutting interest rates anytime soon lift the US Dollar to its highest level since April 10, touched on Friday.
- Meanwhile, Japan's robust Household Spending data and a fall in real wages for the third straight month in March contributed to fears of broader, more entrenched price increases in Japan. This backs the case for further interest rate hikes by the Bank of Japan, though the trade uncertainty forced the central bank to adopt a cautious stance.
- In fact, BoJ Governor Kazuo Ueda acknowledged that the timeline for underlying inflation to reach the central bank's 2% target has been delayed. However, minutes from the BoJ's monetary policy meeting held on March 18-19 revealed last Thursday that the central bank remains ready to hike interest rates further if inflation trends hold.
- Investors now look forward to the release of US inflation figures later this week, which, along with Fed Chair Jerome Powell's appearance on Thursday, will influence the USD price dynamics. Apart from this, Japan's first-quarter Gross Domestic Product report on Friday should provide some meaningful impetus to the USD/JPY pair.
USD/JPY approaches 61.8% Fibo. around the 146.80-146.85; seems poised to climb further
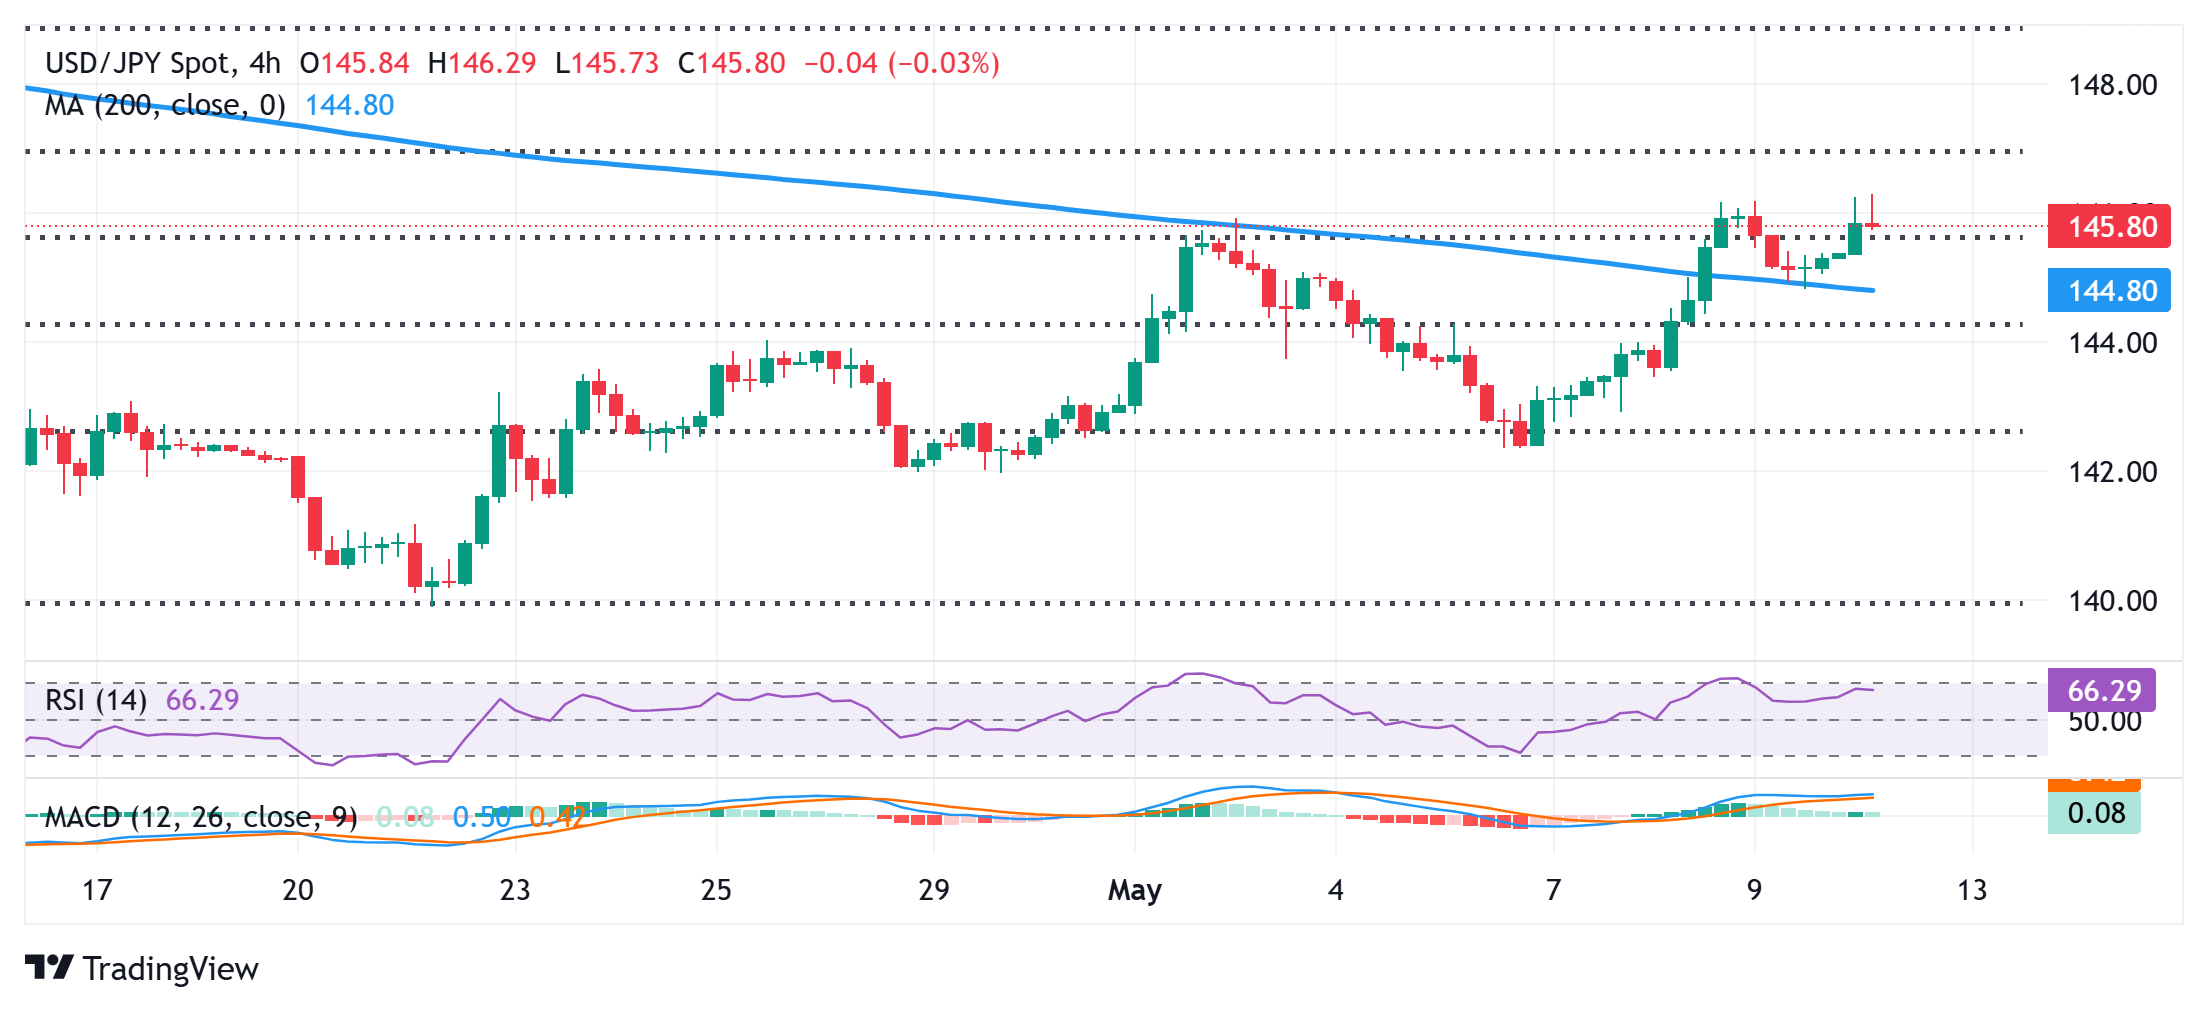
From a technical perspective, the USD/JPY pair now seems to have found acceptance above the 50% Fibonacci retracement level of the March-April downfall. Moreover, oscillators on the daily chart have again started gaining positive traction and are holding in the bullish territory on hourly charts, suggesting that the path of least resistance for spot prices is to the upside. Hence, some follow-through strength towards the 146.80-146.85 region, representing the 61.8% Fibo. level, looks like a distinct possibility. This is closely followed by the 147.00 round-figure mark, which, if cleared, should set the stage for a further near-term appreciating move.
On the flip side, the 145.55 area, or the 50% level, now seems to protect the immediate downside, below which the USD/JPY could accelerate the slide towards the 145.00 psychological mark. The latter coincides with the 200-period Simple Moving Average (SMA) on the 4-hour chart and should act as a pivotal point. A convincing break below might prompt some technical selling and drag spot prices to the next relevant support near the 144.45 region en route to the 144.00 round figure.
Risk sentiment FAQs
In the world of financial jargon the two widely used terms “risk-on” and “risk off'' refer to the level of risk that investors are willing to stomach during the period referenced. In a “risk-on” market, investors are optimistic about the future and more willing to buy risky assets. In a “risk-off” market investors start to ‘play it safe’ because they are worried about the future, and therefore buy less risky assets that are more certain of bringing a return, even if it is relatively modest.
Typically, during periods of “risk-on”, stock markets will rise, most commodities – except Gold – will also gain in value, since they benefit from a positive growth outlook. The currencies of nations that are heavy commodity exporters strengthen because of increased demand, and Cryptocurrencies rise. In a “risk-off” market, Bonds go up – especially major government Bonds – Gold shines, and safe-haven currencies such as the Japanese Yen, Swiss Franc and US Dollar all benefit.
The Australian Dollar (AUD), the Canadian Dollar (CAD), the New Zealand Dollar (NZD) and minor FX like the Ruble (RUB) and the South African Rand (ZAR), all tend to rise in markets that are “risk-on”. This is because the economies of these currencies are heavily reliant on commodity exports for growth, and commodities tend to rise in price during risk-on periods. This is because investors foresee greater demand for raw materials in the future due to heightened economic activity.
The major currencies that tend to rise during periods of “risk-off” are the US Dollar (USD), the Japanese Yen (JPY) and the Swiss Franc (CHF). The US Dollar, because it is the world’s reserve currency, and because in times of crisis investors buy US government debt, which is seen as safe because the largest economy in the world is unlikely to default. The Yen, from increased demand for Japanese government bonds, because a high proportion are held by domestic investors who are unlikely to dump them – even in a crisis. The Swiss Franc, because strict Swiss banking laws offer investors enhanced capital protection.
Author

Haresh Menghani
FXStreet
Haresh Menghani is a detail-oriented professional with 10+ years of extensive experience in analysing the global financial markets.