|

IYR Forecasting: The path & buying, the dips at the Blue Box

In this technical blog we’re going to take a quick look at the Elliott Wave charts of IYR ETF from the Group 3 , published in members area of the Elliottwave-Forecast.  As our members know, we’ve been calling rally in the ETF due to impulsive bullish sequences within the cycle from the March 2020 low. We recommended members to avoid selling in any proposed pull back and keep on buying the dips in 3,7,11 swings.  Recently  IYR made pull back that has unfolded as Elliott Wave Zig Zag pattern which has given us good entries for the long side . In the further text we are going to explain the Elliott Wave Forecast and trading strategy.

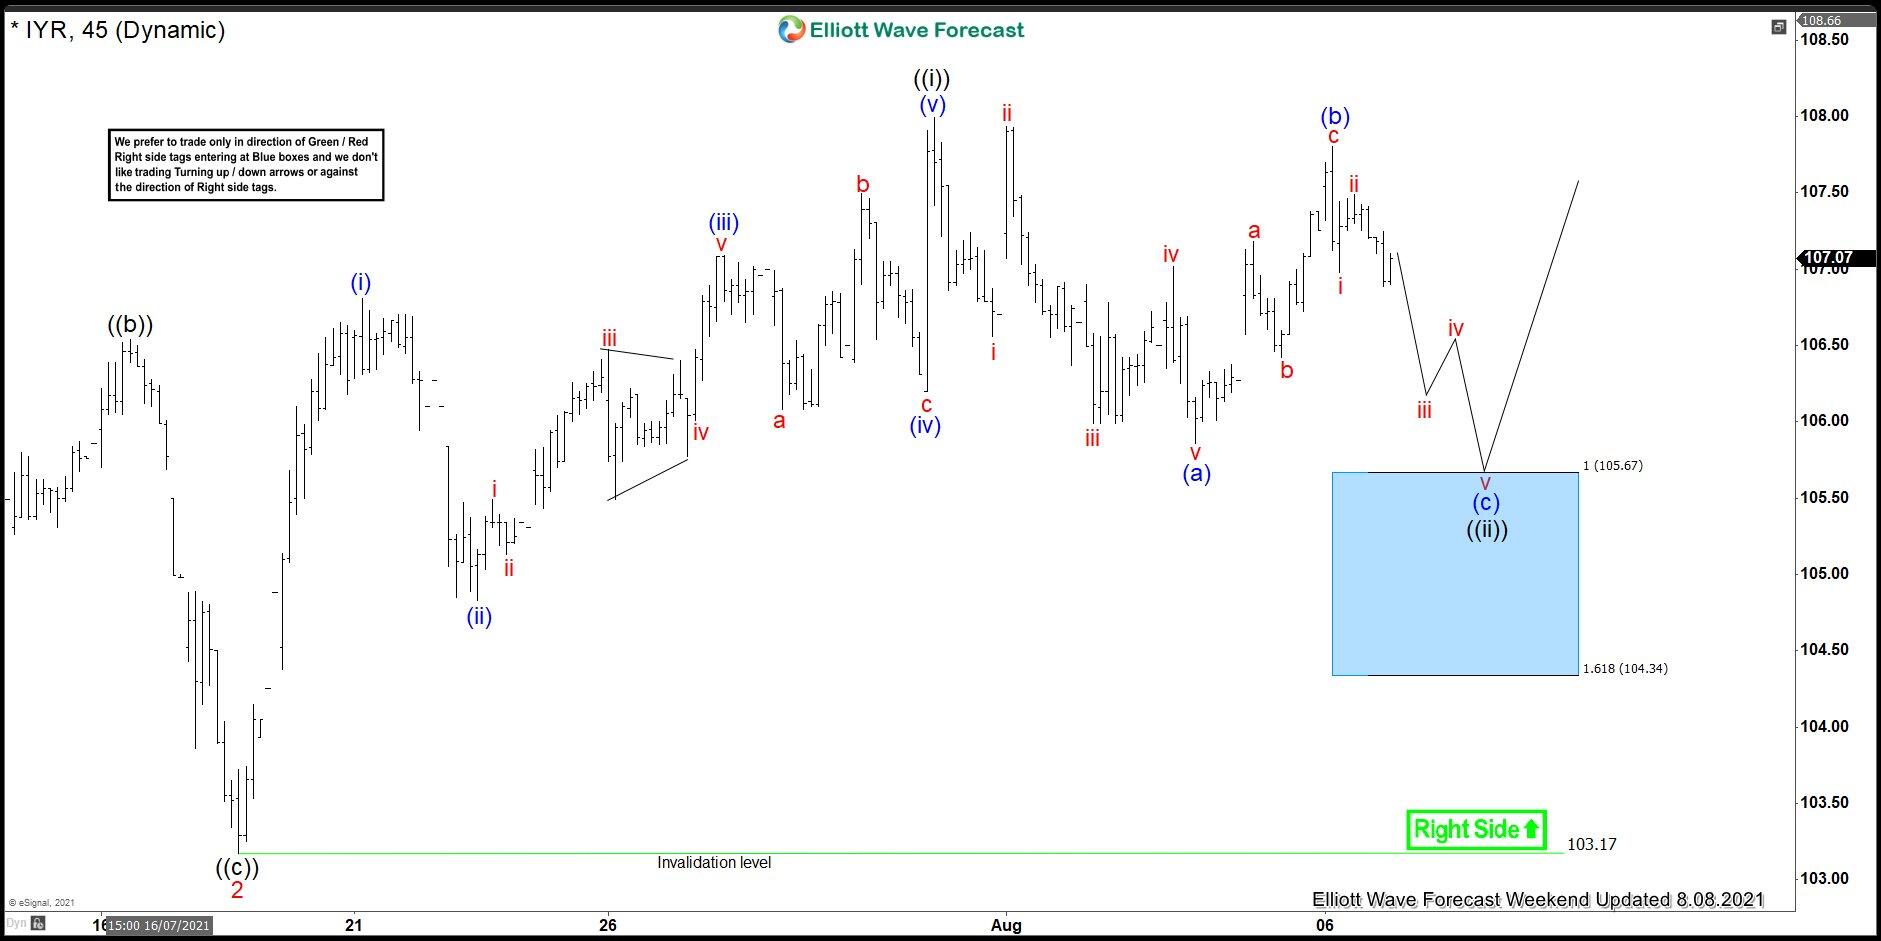
IYR is doing pull back against the 103.17 low , unfolding as Elliott Wave Zig Zag Pattern. First leg (a) shows clear 5 waves, looking as leading diagonal. We assume that this was the first leg of the Zig Zag pull back that still needs to see another leg down. After Leading Diagonal in (a) we got clear 3 waves bounce in (b) blue, after which the price started turning lower again. For the ((ii)) target we use (a)-(b) equal legs,  blue box.  That area comes at 105.67-104.34 which is entry area for the buyers.  As the main trend is bullish we expect buyers to appear for 3 waves bounce at least. Once bounce reaches 50 Fibs against the (b) blue high, we will make long position risk free ( put SL at BE). As our members know, Blue Boxes are no enemy areas , giving us 85% chance to get a bounce.

IYR 1 Hour Elliott Wave Analysis 8.15.2021

Eventually IYR made another down toward blue box area 105.67-104.34 and found buyers as we expected.  We got nice reaction from the blue box, which reached 50 fibs against the connector,  so member who entered the long positions are risk free at this stage . 2 red pull back is counted completed at the 105.21 low , when we could be trading in 3 red now. We would like to see break above previous 1 red peak to confirm next leg up is in progress. If the price breaks 105.21 low, then new price structure will denied proposed count and pull back would be still in progress as 7 swings.

Keep in mind that market is dynamic and presented view could have changed in the mean time.  Best instruments to trade are those having incomplete bullish or bearish swings sequences. We put them in Sequence Report and best among them are shown in the Live Trading Room. You can check most recent charts in the membership area of the site.

Premium

You have reached your limit of 3 free articles for this month.

Start your subscription and get access to all our original articles.

Subscribe to PremiumSign In

Author

Elliott Wave Forecast Team

Elliott Wave Forecast Team

ElliottWave-Forecast.com

More from Elliott Wave Forecast Team
Share:

Markets move fast. We move first.

Orange Juice Newsletter brings you expert driven insights - not headlines. Every day on your inbox.

By subscribing you agree to our Terms and conditions.

Editor's Picks

EUR/USD holds around 1.1750 after weak German and EU PMI data

EUR/USD maintains its range trade at around 1.1750 in European trading on Tuesday. Weaker-than-expected December PMI data from Germany and the Eurozone make it difficult for the Euro to find demand, while investors refrain from taking large USD positions ahead of key employment data.

GBP/USD climbs above 1.3400 after upbeat UK PMI data

GBP/USD gains traction and trades in positive territory above 1.3400 on Tuesday as the British Pound benefits from upbeat PMI data. Later in the day, crucial data releases from the US, including Nonfarm Payrolls, Retail Sales and PMI, could trigger the next big action in the pair.

Gold retreats from seven week highs on profit-taking; all eyes on US NFP release

Gold price loses momentum below $4,300 during the early European trading hours on Tuesday, pressured by some profit-taking and weak long liquidation from the shorter-term futures traders. Furthermore, optimism around Ukraine peace talks could weigh on the safe-haven asset like Gold.

US Nonfarm Payrolls expected to point to cooling labor market in November

The United States Bureau of Labor Statistics will release the delayed Nonfarm Payrolls (NFP) data for October and November on Tuesday at 13:30 GMT. Economists expect Nonfarm Payrolls to rise by 40,000 in November. The Unemployment Rate is likely to remain unchanged at 4.4% during the same period.

NFP preview: Complex data release will determine if Fed was right to cut rates

The long wait is over, and the Bureau of Labor Statistics in the US will release nonfarm payrolls reports for both November and October at 1330 GMT on Tuesday. The overall NFP figure for October is expected to be -10k, however, it is expected to be influenced by a massive 130k drop in federal department workers. 

BNB Price Forecast: BNB slips below $855 as bearish on-chain signals and momentum indicators turn negative

BNB, formerly known as Binance Coin, continues to trade down around $855 at the time of writing on Tuesday, after a slight decline the previous day. Bearish sentiment further strengthens as BNB’s on-chain and derivatives data show rising retail activity.