|

Is this a healthy pullback or the prelude to a market crash? This analogue reveals clues [Video]

Watch the video extracted from the WLGC live session before market open on 24 Oct 2023 below to find out the following:

  • How to use an analogue comparison to judge the current market trend?

  • The existing red flag that traders and investors need to be very cautious

  • The bearish case that the bull must watch out for

  • The key level the S&P 500 needs to commit to kick-start a relief rally

  • And a lot more

The bullish vs. bearish setup is 39 to 567 from the screenshot of my stock screener below pointing to a negative market environment.

Chart

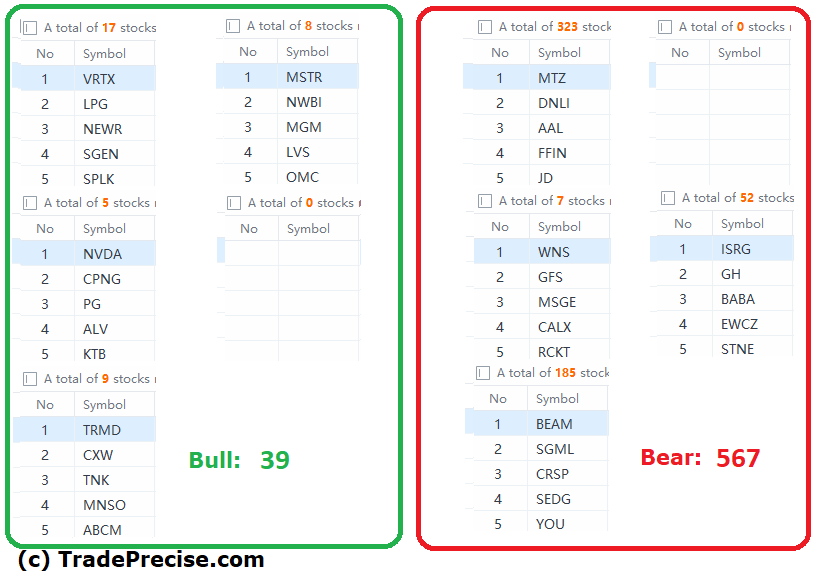
Despite the long-term market breadth signals a red flag while the short-term market breadth approaches the deeply oversold level, it is critical to monitor the S&P 500 as discussed in the video to get the confirmation.

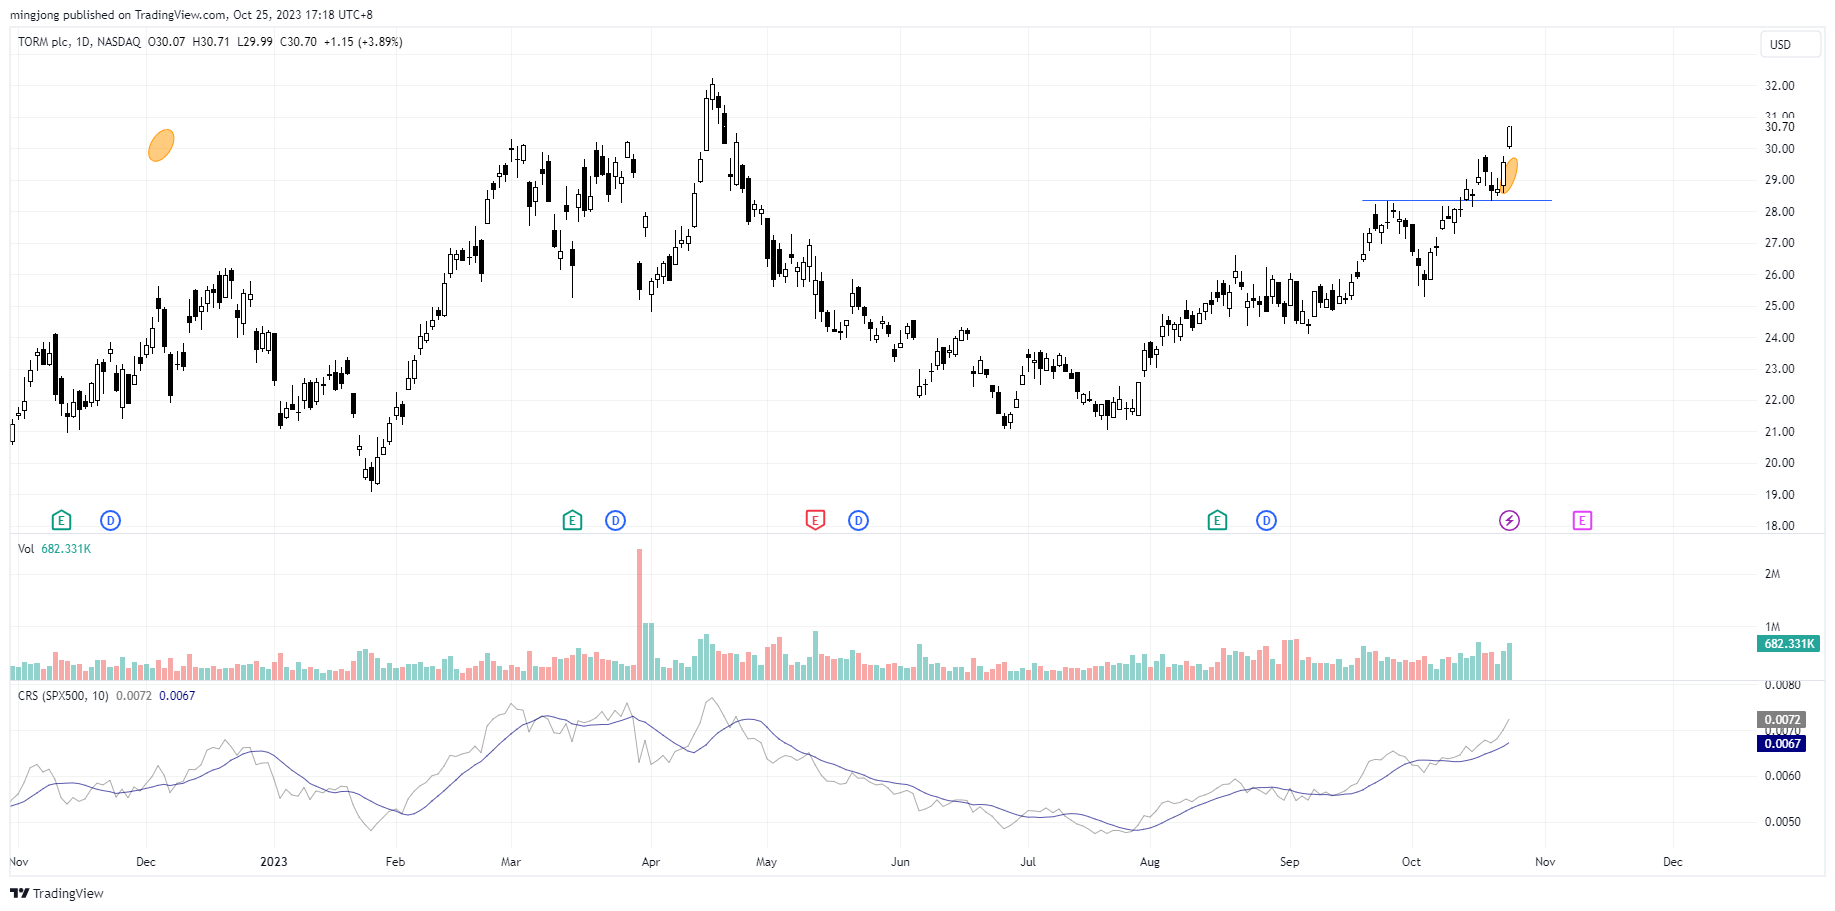
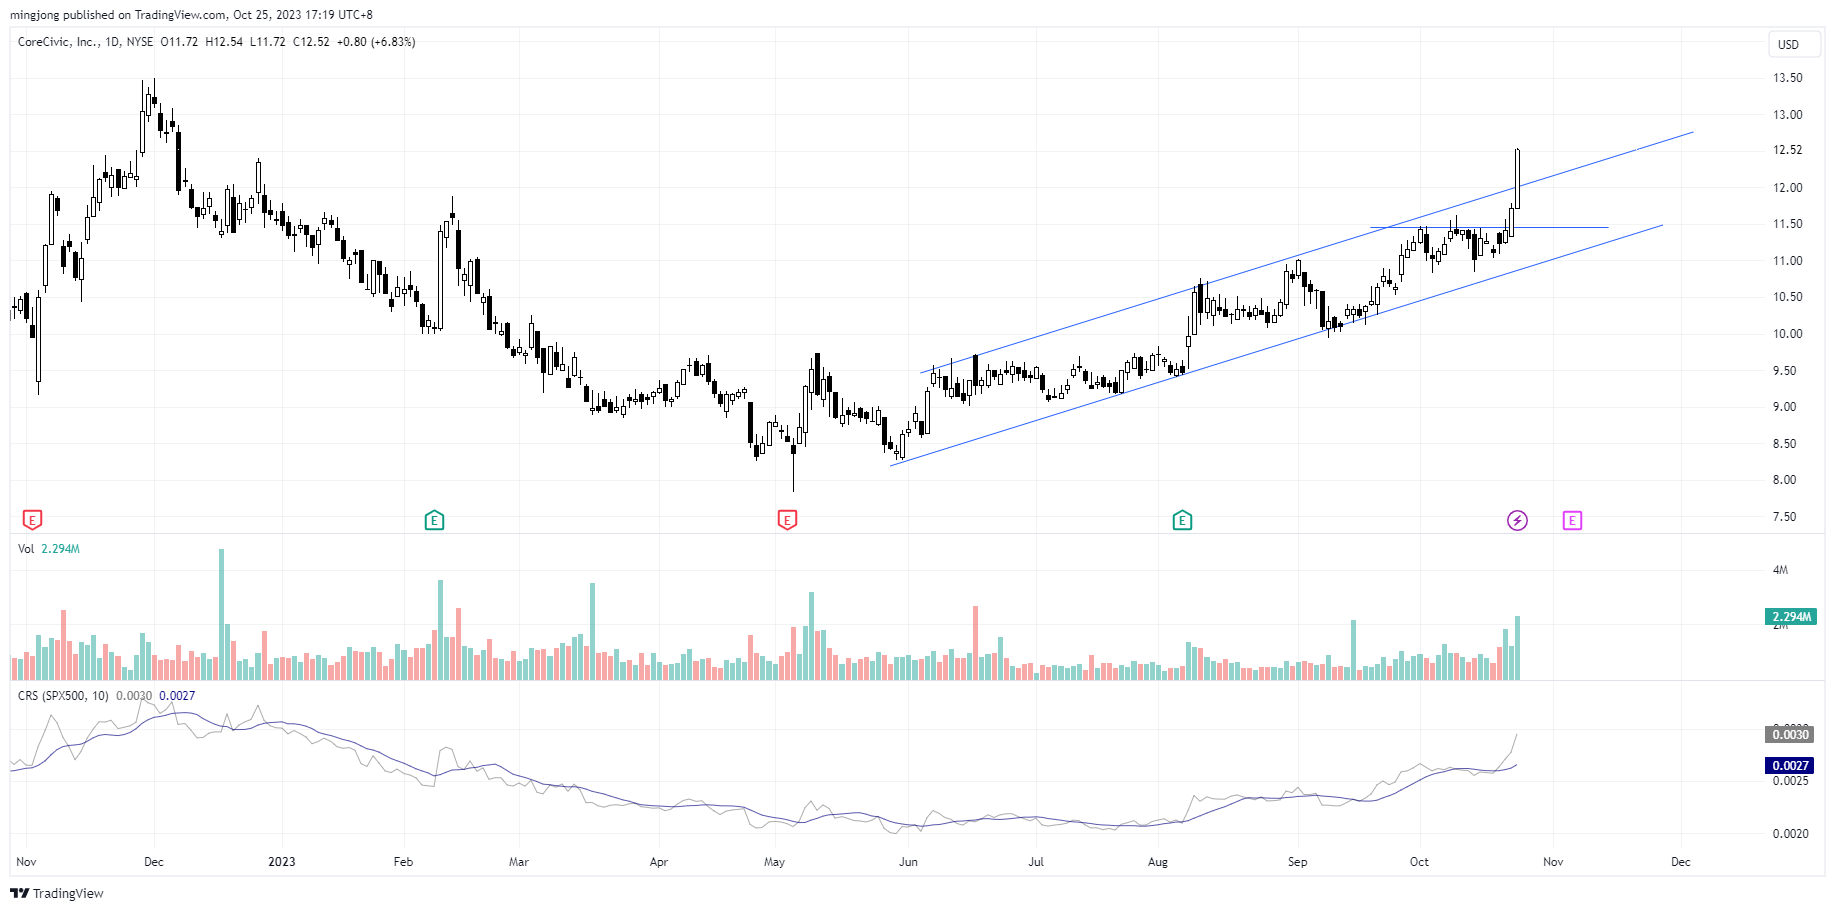
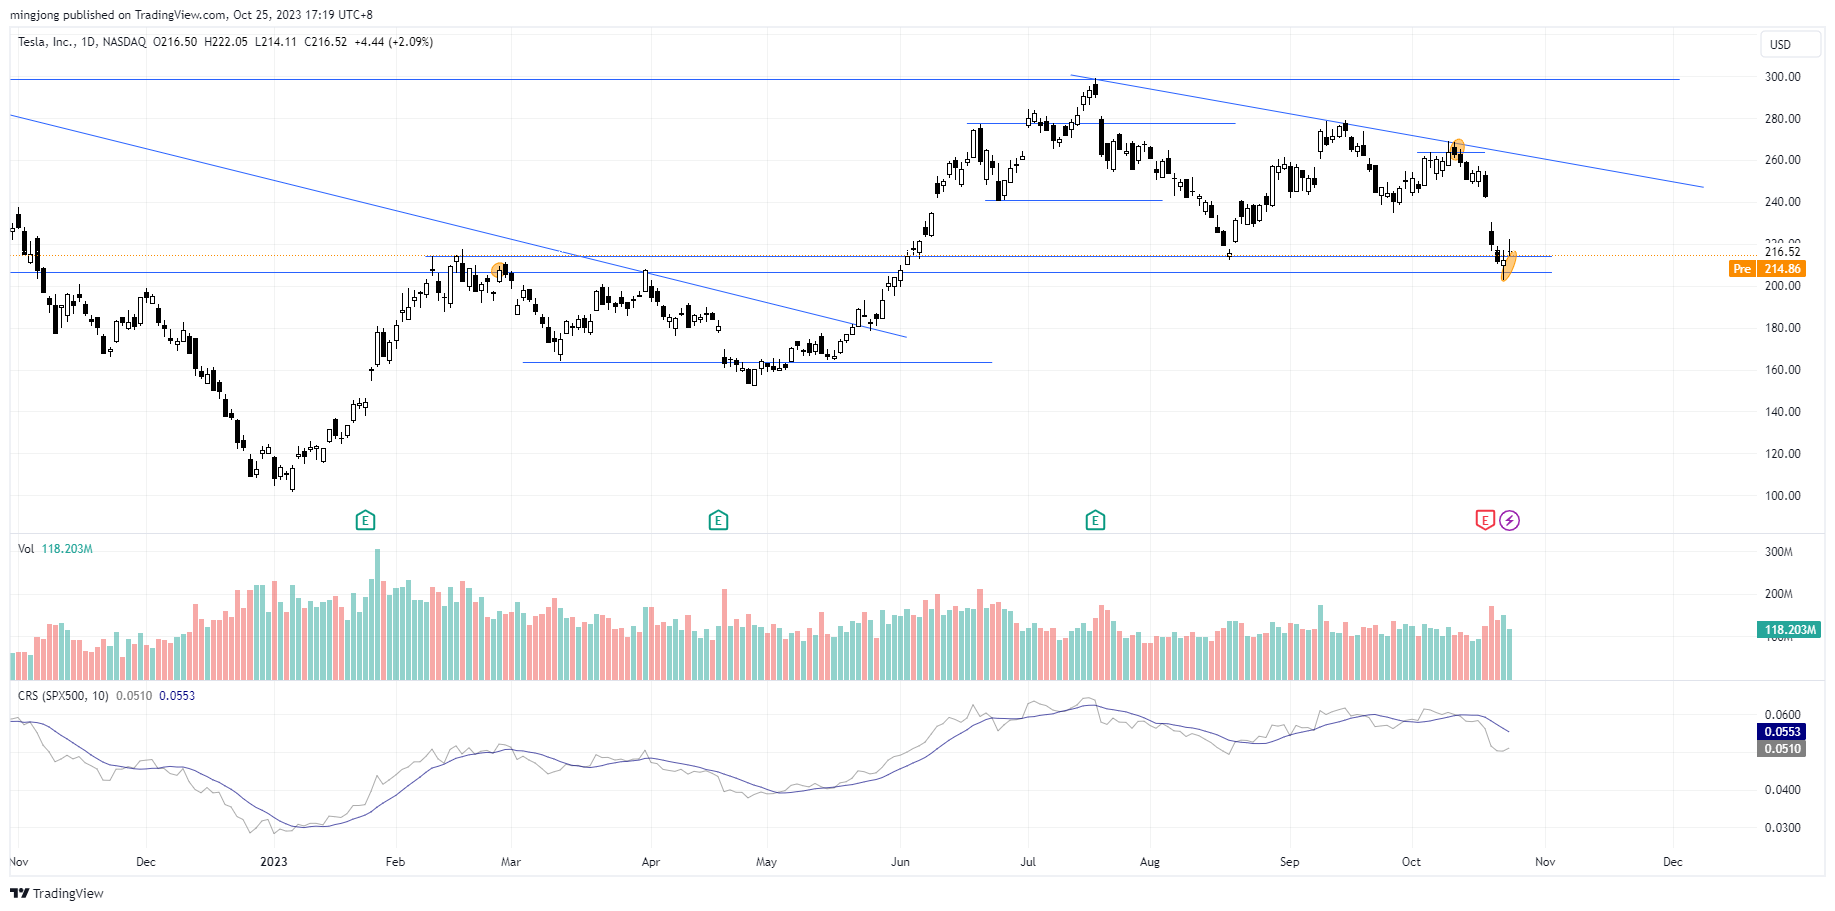
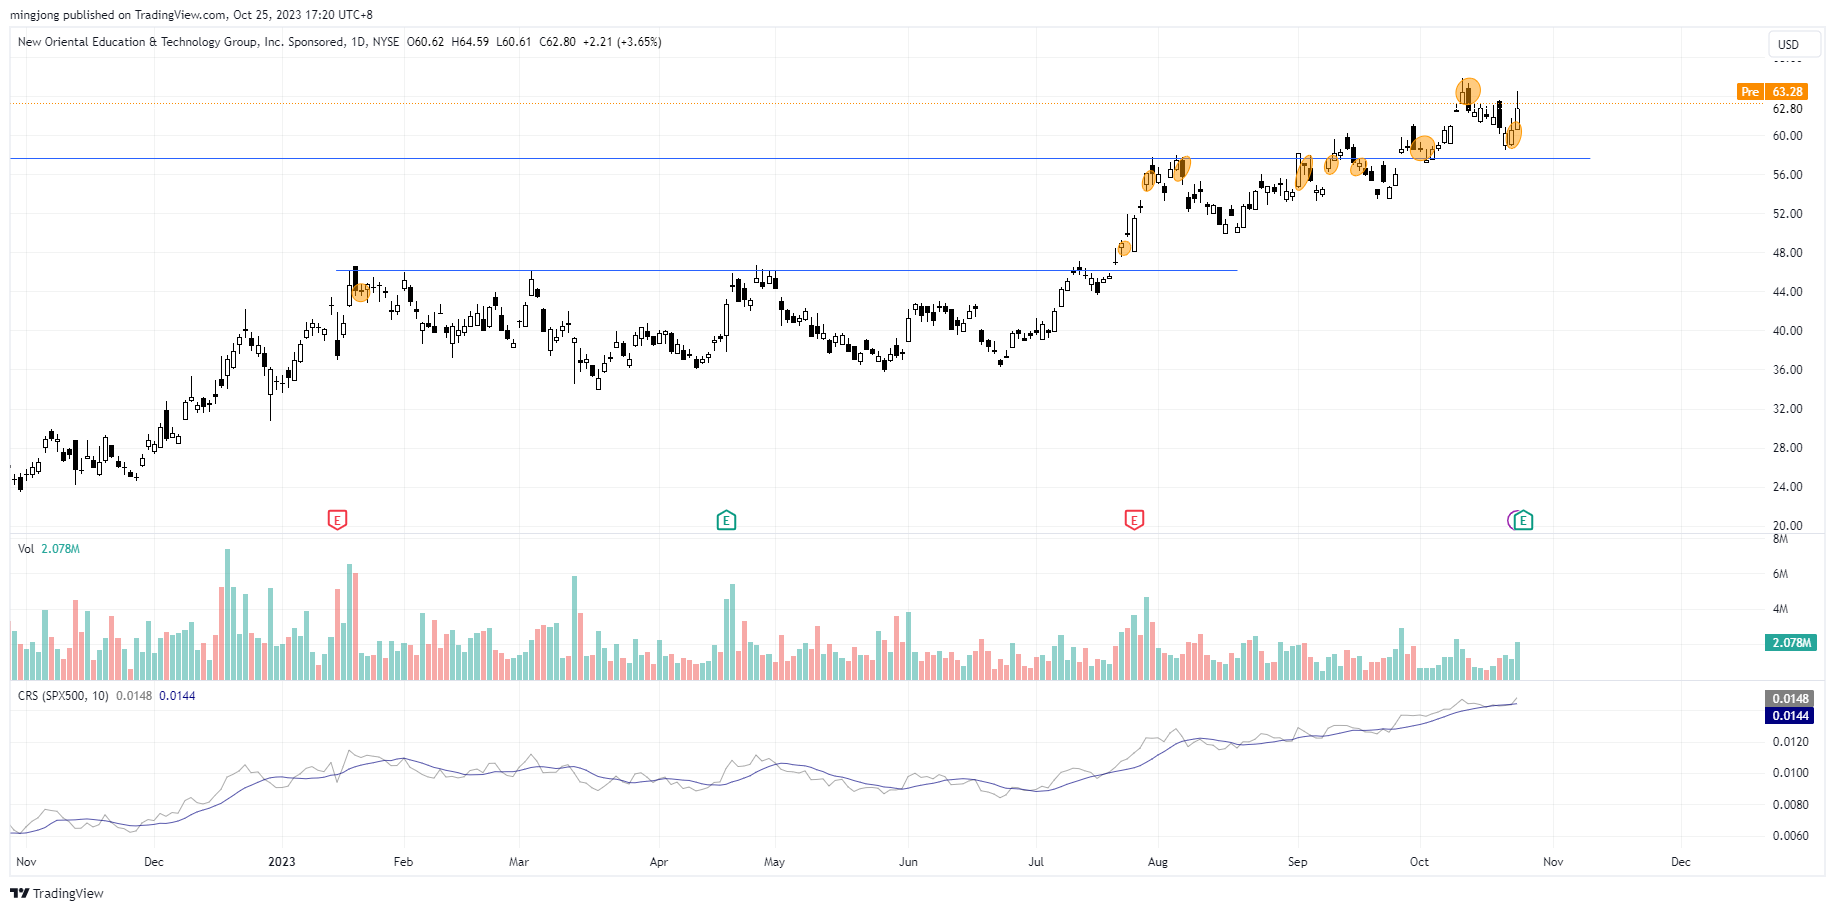
4 “low hanging fruits” (TRMD, CXW, etc…) trade entries setup + 7 others (TSLA, EDU, etc…) plus 25 “wait and hold” candidates are discussed in the video (32:43) accessed by subscribing members below.

TRMD trade entry setup
CXW trade entry setup
TSLA trade entry setup
EDU trade entry setup

Author

Ming Jong Tey

Ming Jong Tey

Independent Analyst

Ming Jong Tey has been trading since 2008. He started his learning journey from technical analysis (indicators, Fibonacci, etc...) to value investing. Throughout his journey, he develops an interest in price action with chart pattern trading.

More from Ming Jong Tey
Share:

Editor's Picks

EUR/USD remains heavy near 1.1600 after hot EU inflation data

EUR/USD remains heavily offered near 1.1600, six-week lows, in the European session on Tuesday. The pair fails to find any inspiration from a surprise pick up in Eurozone inflation for February, as the US Dollar continues to attract safe haven flows amid escalating geopolitical tensions in the Middle East. 

GBP/USD attacks 1.3300, refreshing three-month lows

GBP/USD is deep in the red near 1.3300, accelerating its downside to renew three-month lows in European trading on Tuesday. The ongoing escalation in the Iran war, combined with rising Oil prices, weighs negatively on the higher-yielding Pound Sterling as the US Dollar capitalizes on increased haven demand.

Gold falls below $5,300 as stronger USD counter Middle East woes

Gold attracts some intraday selling and falls below $5,300 on Tuesday. The US Dollar climbs to a fresh high since January 20 and turns out to be a key factor exerting downward pressure on the commodity. However, concerns about a broader regional conflict in the Middle East continue to weigh on investors' sentiment and underpin demand for the traditional safe-haven bullion.

Stellar risks deeper losses as derivatives metrics turn negative

Stellar is trading red below $0.16 at the time of writing on Tuesday, after a slight recovery the previous day. Weakening derivatives data caps the recovery, while an unfavorable technical outlook projects a deeper correction for the XLM token in the upcoming days.

Middle East conflict ramps up a gear as energy price spike rips through markets

It’s another risk off day as geopolitical headwinds continue to batter financial markets. Although markets calmed during the US session and US stocks managed to post gains on Monday, this has not fed through to the European session, and stocks and bonds are sharply lower for a second day.

Hyperliquid Price Forecast: HYPE rises on commodities demand amid US-Iran war

Hyperliquid (HYPE) steadies above $33 at press time on Tuesday, marking its fourth consecutive day of recovery in a broadly volatile market due to the ongoing US-Israel strikes on Iran.