|

Is Nu Holdings (NU) ready for next rally?

NU Holdings Ltd., (NU) provides digital banking platform in Brazil, Mexico, Colombia, Germany, Argentina, United States & Uruguay. It offers spending solutions comprising credit & prepaid cards, mobile payment solutions & integrated mall that enables customers to purchase goods & services from various ecommerce retailers. It is based in Brazil, comes under Financial services sector & trades as “NU” ticker at NYSE.

As shown in the previous article, NU favored bounce in ((B)), which ended at $14.08 high & resume downside in ((C)). Further weakness will confirm below $10.18 low to extend towards $8.10 or lower levels to finish II.

NU – Elliott Wave latest weekly view

Chart

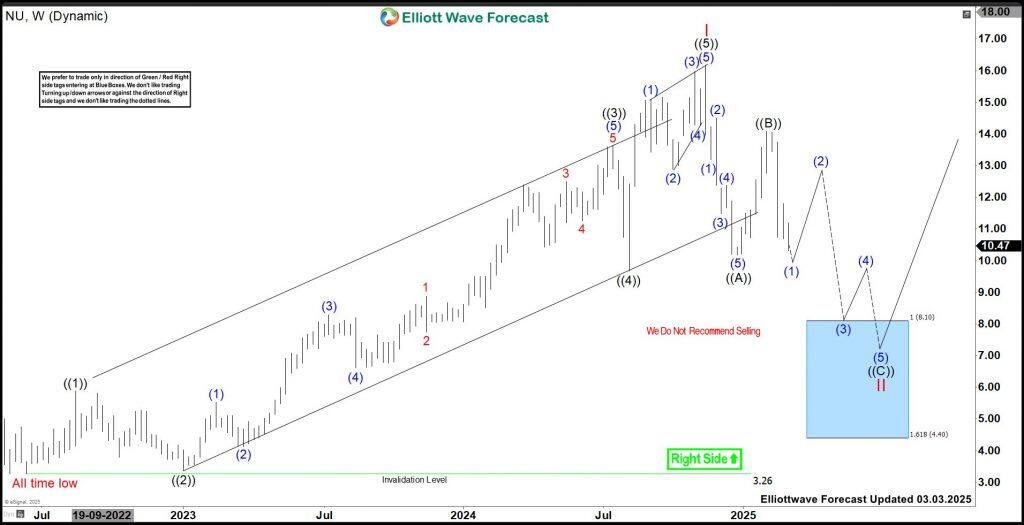
It ended impulse sequence I at $16.15 high from June-2022 low. Within I sequence, it placed ((1)) at $5.88 high & ((2)) at $3.39 low as dip pullback. It ended ((3)) as extended sequence at $13.64 high in July-2024 & ((4)) as sharp pullback at $9.67 low as 0.382 Fibonacci retracement of ((3)). Finally, it ended ((5)) as diagonal sequence from August-2024 low at $16.15 high as I expected from last update.

NU – Elliott Wave weekly view from 1.20.2025

Chart

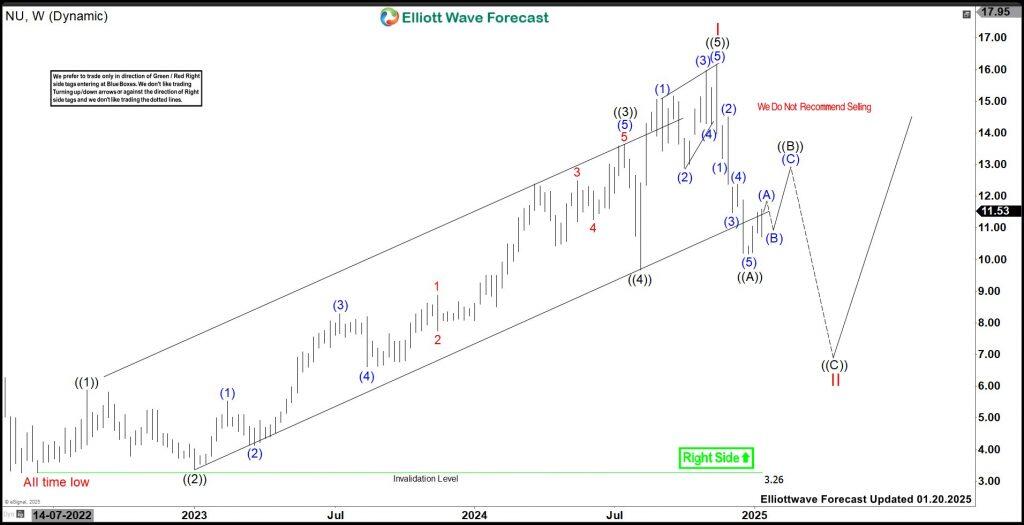
Below $16.15 high, it ended ((A)) of II at $10.18 low & ((B)) at $14.08 high on 2.03.2025. Currently, it favors downside in (1) of ((C)) & expect downside before bounce in (2). It needs to break below $10.18 low to confirm the ((C)) down. It expects bounce of (2) to fail below $14.08 high to turn lower in (3). Until it breaks below $10.18 low, it can do flat structure in ((B)), if breaks above $14.08 high. In that case, the extension area for ((C)) will change accordingly. We like to buy the pullback between $8.10 – $4.40 area against June-2022 low to extend higher.

Author

Elliott Wave Forecast Team

Elliott Wave Forecast Team

ElliottWave-Forecast.com

More from Elliott Wave Forecast Team
Share:

Editor's Picks

EUR/USD flirts with daily highs, retargets 1.1900

EUR/USD regains upside traction, returning to the 1.1880 zone and refocusing its attention to the key 1.1900 barrier. The pair’s slight gains comes against the backdrop of a humble decline in the US Dollar as investors continue to assess the latest US CPI readings and the potential Fed’s rate path.

GBP/USD remains well bid around 1.3650

GBP/USD maintains its upside momentum in place, hovering around daily highs near 1.3650 and setting aside part of the recent three-day drop. Cable’s improved sentiment comes on the back of the Greenback’s  irresolute price action, while recent hawkish comments from the BoE’s Pill also collaborate with the uptick.

Gold clings to gains just above $5,000/oz

Gold is reclaiming part of the ground lost on Wednesday’s marked decline, as bargain-hunters keep piling up and lifting prices past the key $5,000 per troy ounce. The precious metal’s move higher is also underpinned by the slight pullback in the US Dollar and declining US Treasury yields across the curve.

Crypto Today: Bitcoin, Ethereum, XRP in choppy price action, weighed down by falling institutional interest 

Bitcoin's upside remains largely constrained amid weak technicals and declining institutional interest. Ethereum trades sideways above $1,900 support with the upside capped below $2,000 amid ETF outflows.

Week ahead – Data blitz, Fed Minutes and RBNZ decision in the spotlight

US GDP and PCE inflation are main highlights, plus the Fed minutes. UK and Japan have busy calendars too with focus on CPI. Flash PMIs for February will also be doing the rounds. RBNZ meets, is unlikely to follow RBA’s hawkish path.

Ripple Price Forecast: XRP potential bottom could be in sight

Ripple edges up above the intraday low of $1.35 at the time of writing on Friday amid mixed price actions across the crypto market. The remittance token failed to hold support at $1.40 the previous day, reflecting risk-off sentiment amid a decline in retail and institutional sentiment.