Is it time to buy or sell Bank of America after Warren Buffet's move?

Warren Buffet recently sold millions of shares of Bank of America, leaving many stock traders wondering what their next move should be. With the stock price hovering around $35-$38, the dilemma is real: should you sell your shares or hold onto them, hoping for a rebound?
Buffet's decision adds to the confusion. Should you follow his lead?
Or could this be a golden opportunity to buy?
Let’s break it down into 3 simple steps to make the best decision.
Step 1: Understand Warren Buffet’s selling strategy
What made Buffet sell?
Knowing why Warren Buffet sold Bank of America is key. Buffett doesn’t sell stocks whimsically. His decisions relate to broader market trends, company performance, or even diversification needs.
His strategy unpacked
-
Market Trends: Buffet examines market sentiment and long-term outlooks. He often sells when he believes a company is overvalued or when broader markets hint at downturns.
-
Company Performance: If a company’s fundamentals start to weaken, Buffet might decide it's time to sell. It doesn't necessarily mean the company is bad; it’s just not meeting his strict criteria.
-
Diversification: Sometimes, selling is about balancing his portfolio. If one sector becomes too large a part of his holdings, he might sell some to diversify.
Quick example
Buffet’s sale of IBM in 2018 wasn’t because IBM is a bad company but because he saw better opportunities elsewhere, like in Apple.
What you can do
Analyze if Buffet’s reasons apply to your case. If it’s about broader market trends, those trends affect you, too. But if it's about his portfolio's diversification, that might not influence your decision as much.
FACT: Despite these sales, Berkshire Hathaway (Warren Buffet) retains approximately 961.65 million shares of Bank of America, representing about 12.3% of the company's outstanding shares. This makes Bank of America Berkshire Hathaway's second-largest holding after Apple.
Step 2: Examine Bank of America’s stock chart
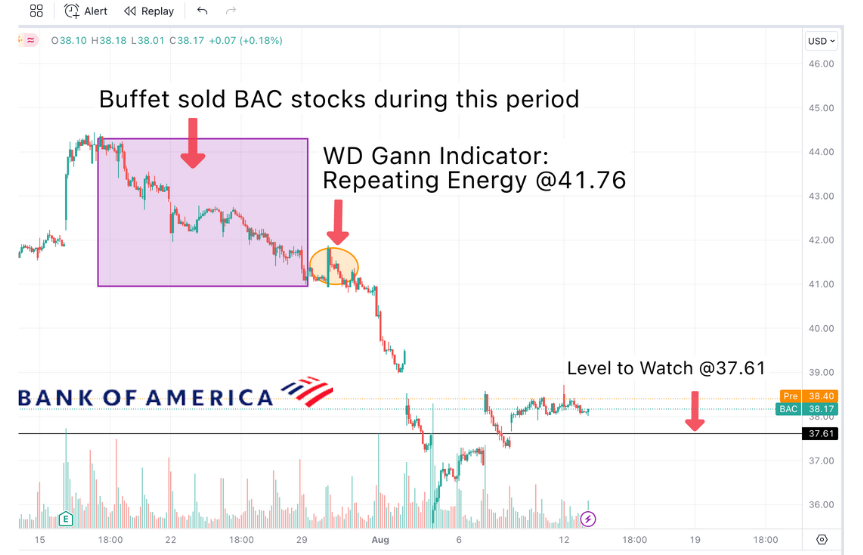
Bank of America hit a reversal at the $44.44 level, and the price has dropped to around $35. This isn’t just a random dip; it reflects underlying patterns and behaviors in the market.
Look for the repeat pattern
There is a Repeating Energy pattern at the $41.76 level.
The repeating energy indicates an implicit rule of a downward trend, as the market consistently makes lower lows, confirming the downward movement and leading to a drop in the stock price to $35.
Key levels to watch
The $37.61 level is a critical spot to watch for any implicit rule of an uptrend “repeating energy patterns” that could indicate the next move.
Step 3: Apply W.D. Gann’s principles
Who is W.D. Gann?
W.D. Gann was a legendary stock trader known for his unique market movement prediction methods. His Stock and Commodities Course is still studied for its insights into trading strategies that combine geometry, astrology, and ancient mathematics.
Gann’s key principles
-
Angles and Cycles: Gann believed in the importance of angles and cycles in predicting price changes.
-
Mathematical Relationships: He used mathematical ratios to anticipate price movements.
-
Repeat Patterns: As discussed earlier, identifying repeating patterns is crucial.
Gann’s magic in action
When the 1929 stock market crash happened, Gann had already predicted it months in advance, saving many of his clients from financial ruin.
Quick tip
Use Gann’s methods of Repeat Patterns to analyze Bank of America’s future movements.
Next steps
We've covered three important steps. Remember:
1. Understanding Buffet’s Motive provides clarity on whether to follow his lead.
2. Examining the Stock Chart helps you see Repeat Patterns and price levels.
3. Applying Gann’s Principles offers advanced techniques for making your decision.
Don't let confusion, greed, or fear drive your investing decisions. Armed with the right knowledge and tools, you can navigate these choices with confidence and clarity.
Take control of your financial future today—don't wait until it's too late!
Author

Khit Wong
Gann Explained
As a noted expert on FXStreet.com and in “Technical Analysis of Stocks & Commodities” and "Traders World," I specialize in applying W.D. Gann's complex theories to practical trading.