|

Is HON ready for next big move?

Honeywell International Inc., (HON) engages in the aerospace technologies, building automation, energy & sustainable solutions & industrial automation businesses in the United States, Europe & internationally. It is based in Charlotte, comes under Industrials sector & trades as “HON” ticker at Nasdaq. It is having 130.919 B$ market cap as on 11-March, 2024.

As showing in the previous article from last year, HON favors upside in (3) of ((3)) of III, while dips remain above $189.66 low. It needs to break above $236.86 high to confirm the next bullish sequence.

HON – Elliott Wave weekly view from 2.13.2023

Chart

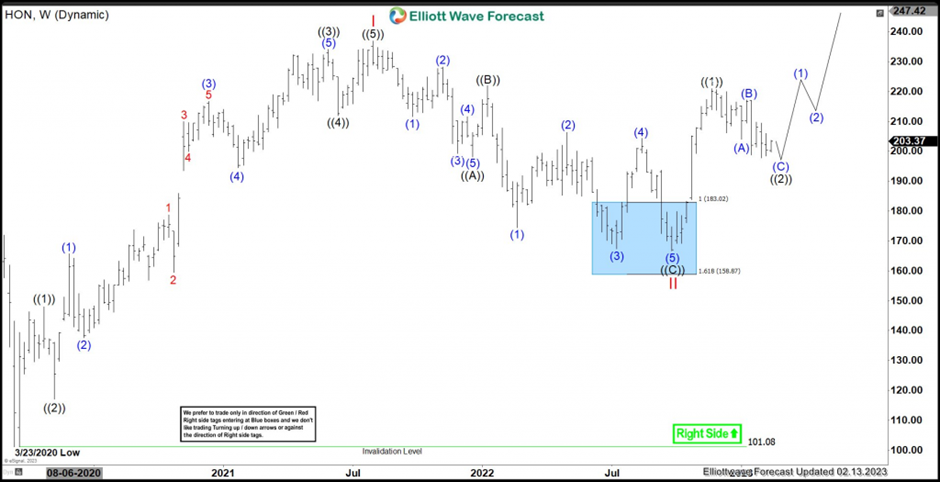
It ended (II) at $101.08 low in weekly sequence in March-2020. Above there, it favors upside in ((3)) of III as impulse sequence, while dips remain above ((2)) low. Within wave I, it placed ((1)) at $147.87 high, ((2)) at $117.11 low, ((3)) at $234.02 high as extended wave, ((4)) at $211.96 low & ((5)) as I at $236.86 high. It placed II at $166.63 low as 0.5 Fibonacci retracement of I as 3 swing pullback. Within III, it placed ((1)) at $220.96 high & ((2)) at $174.88 low as zigzag correction ended in October-2023 low.

HON – Elliott Wave latest weekly view

Chart

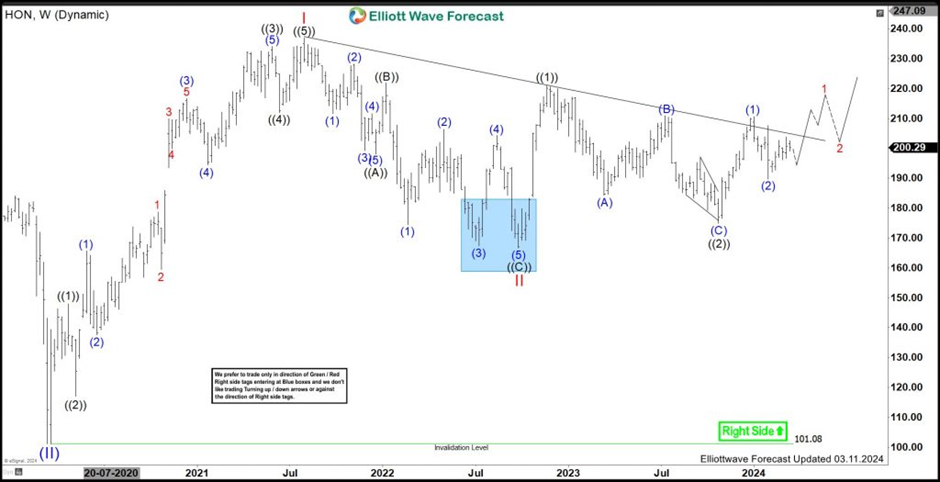
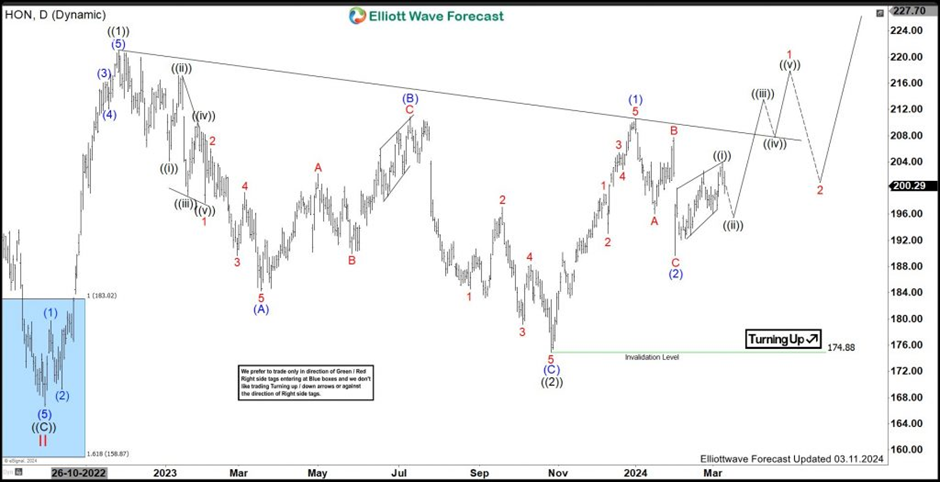
Since ((2)) low, it favored ended (1) of ((3)) at $210.60 high. It placed 1 of (1) at $199.13 high, 2 at $193.01 low, 3 at $205.45 high, 4 at $202.84 low & 5 of (1) at $210.60 high. It corrected in 2 as 0.618 Fibonacci retracement, ended at $189.66 low as 3 swing zigzag correction. Above 2 low, it placed ((i)) of 3 at $203.91 high as diagonal sequence. Currently, it favors ((ii)) correction in 3 or 7 swings before resume upside in ((iii)) of 1 of (3). It needs to break above (1) high to confirm the upside to be (3) as bullish sequence. Until then it can even extend (2) correction, if breaks below $189.66 low before turning higher.

HON – Elliott Wave latest daily 

Chart

Author

Elliott Wave Forecast Team

Elliott Wave Forecast Team

ElliottWave-Forecast.com

More from Elliott Wave Forecast Team
Share:

Editor's Picks

EUR/USD looks offered below 1.1900

EUR/USD keeps its bearish tone unchanged ahead of the opening bell in Asia, returning to the sub-1.1900 region following a firmer tone in the US Dollar. Indeed, the pair reverses two consecutive daily gains amid steady caution ahead of Wednesday’s key US Nonfarm Payrolls release.
 

GBP/USD slips back to daily lows near 1.3640

GBP/USD drops to daily lows near 1.3640 as sellers push harder and the Greenback extends its rebound in the latter part of Tuesday’s session. Looking ahead, the combination of key US releases, including NFP and CPI, alongside important UK data, should keep the pound firmly in focus over the coming days.

Gold the battle of wills continues with bulls not ready to give up

Gold remains on the defensive and approaches the key $5,000 region per troy ounce on Tuesday, giving back part of its recent two day. The precious metal’s pullback unfolds against a firmer tone in the US Dollar, declining US Treasury yields and steady caution ahead of upcoming key US data releases.

Bitcoin's downtrend caused by ETF redemptions and AI rotation: Wintermute

Bitcoin's (BTC) fall from grace since the October 10 leverage flush has been spearheaded by sustained ETF outflows and a rotation into the AI narrative, according to Wintermute.

Dollar drops and stocks rally: The week of reckoning for US economic data

Following a sizeable move lower in US technology Stocks last week, we have witnessed a meaningful recovery unfold. The USD Index is in a concerning position; the monthly price continues to hold the south channel support.

XRP holds $1.40 amid ETF inflows and stable derivatives market

Ripple trades under pressure, with immediate support at $1.40 holding at the time of writing on Tuesday. A recovery attempt from last week’s sell-off to $1.12 stalled at $1.54 on Friday, leading to limited price action between the current support and the resistance.