|

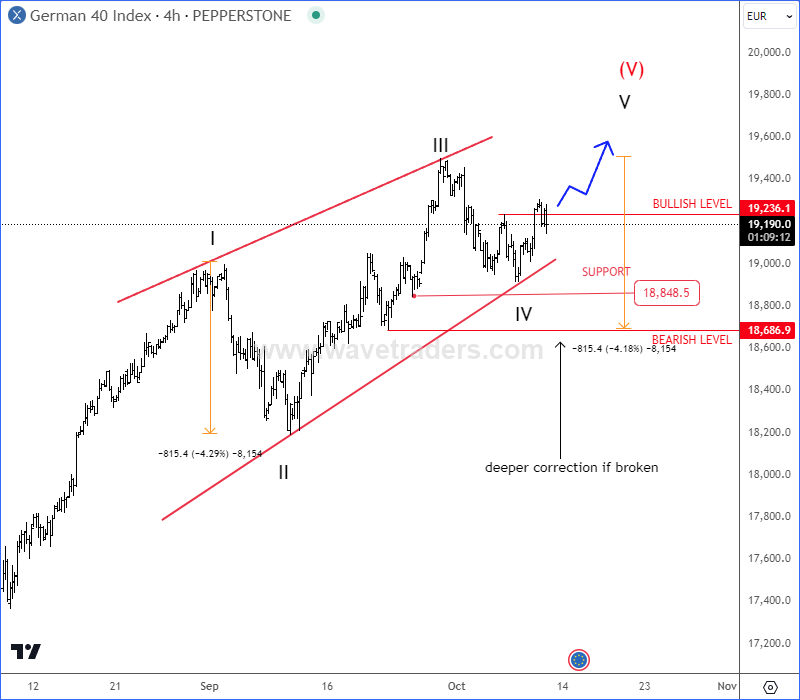
Is Dax trading in a wedge pattern?

Looking at the 4-hour chart of DAX, we can see a strong rebound in the last two months back to new ATH, but bulls can be losing some strength up here as we see price turning back down to 19k area, where overlap with black wave I put wedge shape in action. We are talking about ending diagonal, with wave IV retracement back to around 18850/18900 support, from where we may see a final push higher. Move beyond 19236 bullish level makes room for 19600, for fifth of a fifth.

Break below 18686 level will suggest that DAX is headed lower, at least temporarily.

Chart

Get Full Access To Our Premium Elliott Wave Analysis For 14 Days. Click here.


Get Full Access To Our Premium Elliott Wave Analysis For 14 Days. Click here.

Author

Gregor Horvat

Gregor Horvat

Wavetraders

Experience Grega is based in Slovenia and has been in the Forex market since 2003.

More from Gregor Horvat
Share:

Editor's Picks

EUR/USD weakens to near 1.1900 as traders eye US data

EUR/USD eases to near 1.1900 in Tuesday's European trading hours, snapping the two-day winning streak. Markets turn cautious, lifting the haven demand for the US Dollar ahead of the release of key US economic data, including Retail Sales and ADP Employment Change 4-week average.

GBP/USD stays in the red below 1.3700 on renewed USD demand

GBP/USD trades on a weaker note below 1.3700 in the European session on Tuesday. The pair faces challenges due to renewed US Dollar demand, UK political risks and rising expectations of a March Bank of England rate cut. The immediate focus is now on the US Retail Sales data. 

Gold sticks to modest losses above $5,000 ahead of US data

Gold sticks to modest intraday losses through the first half of the European session, though it holds comfortably above the $5,000 psychological mark and the daily swing low. The outcome of Japan's snap election on Sunday removes political uncertainty, which along with signs of easing tensions in the Middle East, remains supportive of the upbeat market mood. This turns out to be a key factor exerting downward pressure on the safe-haven precious metal.

Bitcoin Cash trades lower, risks dead-cat bounce amid bearish signals

Bitcoin Cash trades in the red below $522 at the time of writing on Tuesday, after multiple rejections at key resistance. BCH’s derivatives and on-chain indicators point to growing bearish sentiment and raise the risk of a dead-cat bounce toward lower support levels.

Follow the money, what USD/JPY in Tokyo is really telling you

Over the past two Tokyo sessions, this has not been a rate story. Not even close. Interest rate differentials have been spectators, not drivers. What has moved USD/JPY in local hours has been flow and flow alone.

Bitcoin Cash trades lower, risks dead-cat bounce amid bearish signals

Bitcoin Cash (BCH) trades in the red below $522 at the time of writing on Tuesday, after multiple rejections at key resistance. BCH’s derivatives and on-chain indicators point to growing bearish sentiment and raise the risk of a dead-cat bounce toward lower support levels.