Is an important peak in March for the NASDAQ 100 off the table?

In our previous update from February 11 about the NASDAQ100, we found that during pre-election years, on average,
“The index bottoms on February 5, peaks around February 15, drops slightly to around February 21, and ultimately rallies to a March 18 high, after which it is all downhill until October.” And we added, based on the Elliott Wave: “Thus, in the short term, we can still allow a last [drop] to ideally reach $24,200 ± 200 …”
Fast forward: the index hit a low on February 5 (gray Wave-a), peaked on February 11 (gray W-b), and reached its bottom on February 17 (orange W-a). See Figure 1 below. So far, so good. However, it then made a secondary high on February 25 (orange W-b), and yesterday it dropped to its lowest level since the November 2025 low (red W-a) in response to the joint military operations in Iran. This detour was unexpected, but we simply can't predict every market move, especially during major geopolitical events, which often cause knee-jerk reactions. The index has now completely erased Monday’s losses.
Figure 1 Short-term EW count for the NASDAQ100
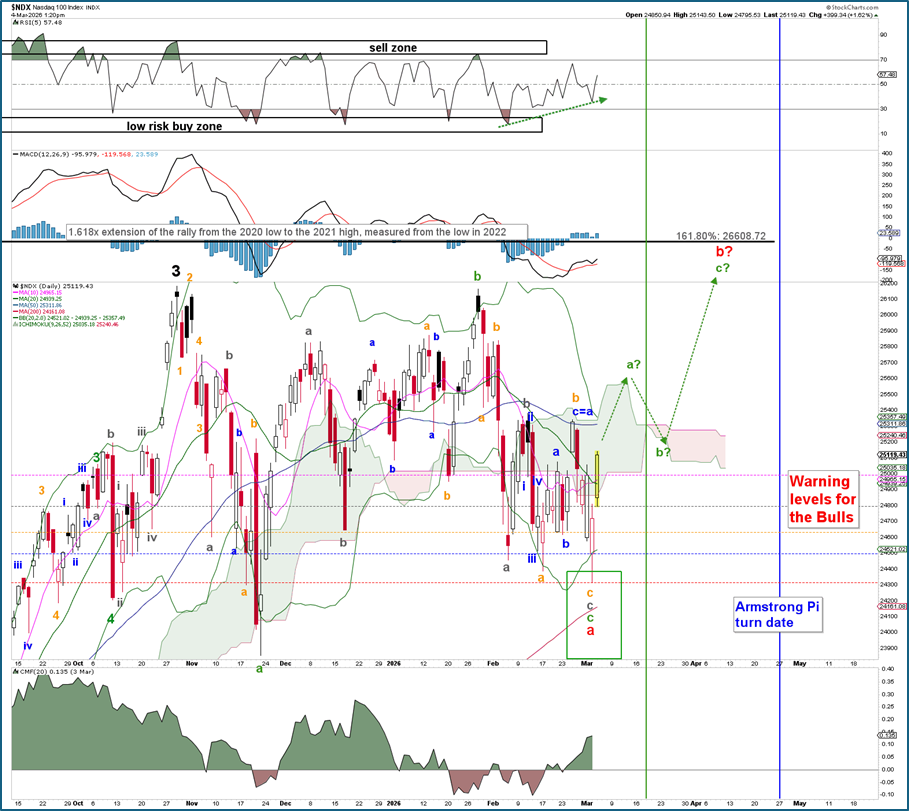
Besides, in our previous update, we were looking for the index to bottom at $24,200 ± 200 for the red W-a. See the green box in Figure 1 above. At Monday’s $24,315 low, this target zone was met.
Given the recent stagnant price action, i.e., the index is now at the same level it was five months ago (!), and due to seasonal factors, we haven’t altered our broader Elliott Wave count, which still indicates a move to roughly $26600 for the red W-b, depending on the index staying above its warning levels*. We’ve only had to update the daily price movements since our last review. But that’s common because daily movements can be noisy, making them less reliable. Weekly movements provide structure, while monthly price action defines the overall trend.
The ~$22,600 level is 161.8% of the 2020-2021 rally (Wave-1), measured from the 2020 low (W-2). The index peaked on October 29 for W-3 but was 500 points short of the ideal 1.618x extension target.
· W-1 rallied from 6772 to 16765 (9993p).
· W-2 bottomed out on October 13, 2022, at 10440.
· W-3 targets: 10440+9992x1.618=26608
When the third wave misses its target, the B-wave of the fourth wave often does the job. Think July 2011, November 2015, October 2018, and February 2020. All these instances featured new highs or new ATHs, which we call irregular B-waves, and were followed by sharp declines: C-waves.
Thus, in the short term, the forecasted larger red W-a did reach its ideal $24,200 ± 200 target zone, albeit via an unexpected brief detour. The index is now most likely in a final three-wave move to approximately $26,600 by late March or possibly mid-April.
*Warning levels for the bulls are: 24992, 24795, 24637, 24497, 24315.
Author

Dr. Arnout Ter Schure
Intelligent Investing, LLC
After having worked for over ten years within the field of energy and the environment, Dr.


